
You have chosen not to allow videos from the 3rd party streaming service (YouTube), if you would like to see these videos, please change your Privacy policy and cookie settings.
National Patient Survey 2021
Survey of UK fertility patients, 2 November – 7 December 2021
Published: April 2022
The key findings are published on this page with a statistical appendix available for download. A separate Quality & Methodology report provides details on survey methodology and patient profile.
Download the underlying dataset as Excel Worksheet.
Table of contents
- Main points
- 1. Introduction
- 2. Recent experience of fertility treatment
- 3. Experience of speaking to a GP about fertility concerns
- 4. Multiple embryo transfers
- 5. Use of donor eggs, sperm, or embryos
- 6. Treatment add-ons
- 7. Knowledge of HFEA & Information/support sources
- About our data
Main points
- Seven in ten (72%) patients1 were satisfied with their latest experience of fertility treatment, with patients most positive about the clinic environment (87%) and being treated with dignity and privacy (87%). They were least satisfied with their partner being involved in conversations/decision-making (70%) or with the level of support given (including access to counselling) (62%).
- Around four in five (78%) patients spoke to a GP prior to starting treatment, usually within one to two years after first trying to conceive. However, less than half (47%) were satisfied with their experience of doing so.
- After speaking to a GP it was generally another 6-18 months before treatment started. However, around a quarter waited over 18 months. Reasons for the wait varied between NHS and privately funded patients, but NHS patients were more likely to have been affected by delays in referrals due to COVID-19 (32% vs. 18% of private patients).
- Looking at the information provided to patients, consent forms for treatment were particularly clear (93%), followed by clarity of the treatment plan (83%) and what to do if there was a medical issue or emergency (79%). Fewer (68%) felt that their own chance of success had been made clear.
- Three in ten (30%) had a multiple embryo transfer during any of their IVF treatments, with most doing so on clinic advice, either due to age and/or previous unsuccessful cycles, or low ovarian reserve/low quality embryos. However, a third (32%) did ask for this to increase their chances of getting pregnant.
- Three-quarters (75%) agreed that the clinic explained the chances of a multiple pregnancy, and around seven in ten (69%) that the clinic discussed the risks associated with multiple births. However, fewer (61%) agreed that the clinic discussed their own individual risk (based on health/age/ethnicity).
- Around three in ten (28%) had used donated eggs, sperm or embryos, with donated sperm most common. Although two-thirds (65%) said they found them easy to access, a quarter (25%) found them difficult. Those who had used donor eggs, sperm or embryos said it was important that the donor’s ethnicity matched their own (82%).
- Two-thirds of patients (65%) had used a treatment add-on, with acupuncture most common (33%), followed by time-lapse imaging (27%). Most add-ons were used by privately funded patients. Of those using an add-on, less than half (46%) felt the cost of the add-on was clear, or that the clinic explained the likely effectiveness of the add-on at increasing the chances of having a baby (46%). Just a third (33%) said that the clinic had explained the potential risks(s) of the add-on.
- Three in five (60%) were familiar with the HFEA, with the top sources of information used by patients being clinic websites (73%), search engines (71%) and social network sites (64%). Online forums were used by over half (56%), with the same proportion using the HFEA website (55%).
- The top five most important factors when choosing a clinic were location (59%), success rates (53%), a good first impression of the clinic/staff (36%), treatment options offered (28%) and cost (26%).
1. Introduction
We undertook the first HFEA national survey of fertility patients in 2018, the results of which were widely used to inform our work. To understand how the landscape has changed, and to help answer some of the questions raised in the Ethnic Diversity in Fertility Treatment report, we repeated the survey in 2021. Many of the questions remain comparable, but there are also several new questions, particularly around multiple embryo transfers and donation use.
The last couple of years have been difficult for fertility patients, with COVID-19 halting fertility treatments for a short time in 2020 and for some, longer wait times for NHS funded treatment. This has clearly had an impact on patient experience. To understand how COVID-19 impacted on the sector please see the State of the Fertility Sector 2020/2021 report.
The survey explores the patient pathway, from accessing GP services, through to a patients’ most recent experience of treatment, decisions around multiple embryo transfers, egg/sperm donation and treatment add-ons.
We had a huge response to the survey, receiving a total of 1,233 completed responses. We are very grateful to everyone who completed the survey, which will inform the work of the HFEA for years to come. It has not been possible to cover everything in this report, but the full underlying dataset is available for download. More information about responses and other statistical information is covered at the end of this report.
2. Recent experience of fertility treatment
2.1. Overall satisfaction with recent treatment
Seven in ten (72%) patients were satisfied with their latest experience of fertility treatment, with almost two in ten (17%) dissatisfied. As Figure 1 illustrates, satisfaction decreased slightly from 2018, where 74% said they were satisfied and 13% dissatisfied.
There were no differences in satisfaction between those whose latest round of treatment was NHS-funded versus privately funded. However, for those who were privately funded, there may be more dissatisfaction with the overall experience when the final costs didn’t match their expectations (25% vs. 11% privately funded overall).
Understandably, patients whose treatment had led to a live birth or were currently pregnant were also more likely to be satisfied (61% vs. 25% currently unsuccessful). Those who had treatment in the past two years were less satisfied than those whose last treatment was between two and five years ago (70% vs. 81%), which coincides with the COVID-19 pandemic.
Patients attending clinics in the North East of England (88%) and the East Midlands (81%2*) were more likely to be most satisfied with their treatment, with patients in the East of England and the West Midlands less likely to be satisfied (both 63%*).
Overall satisfaction with recent treatment, 2018 vs. 2021
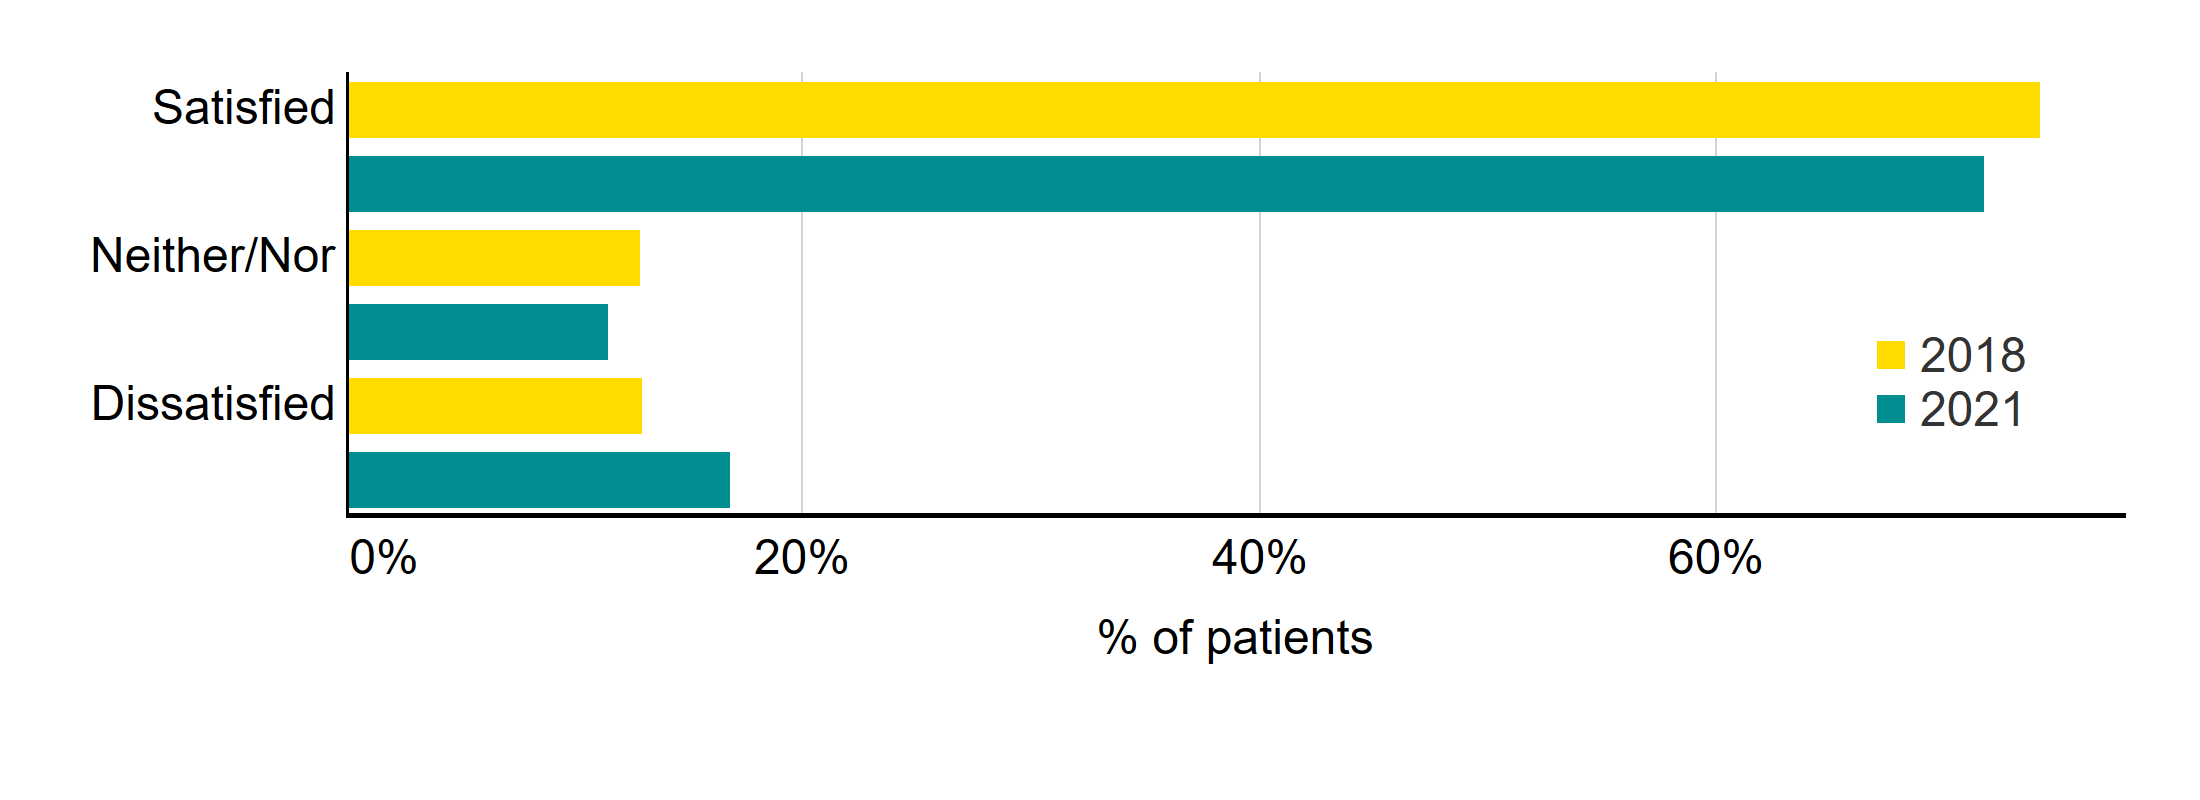
Q: ‘Overall, how satisfied or dissatisfied were you with your most recent experience of fertility treatment?’. Don’t know/Not applicable not shown (N=1,233).
Download the underlying data for Figure 1 as Excel Worksheet.
2.2. Satisfaction with various aspects of treatment
In terms of satisfaction with their most recent treatment, patients were most positive about the clinic environment (87%), and with being treated with dignity and privacy (87%).
Fewer were satisfied that their partner was involved in those decisions (70%), with satisfaction lowest for the level of support given (including access to counselling), at 62%.
Those who have undergone treatment in the past two years generally tended to be less satisfied across each of these statements than those who had treatment between two to five years ago.
Satisfaction with various aspects of treatment
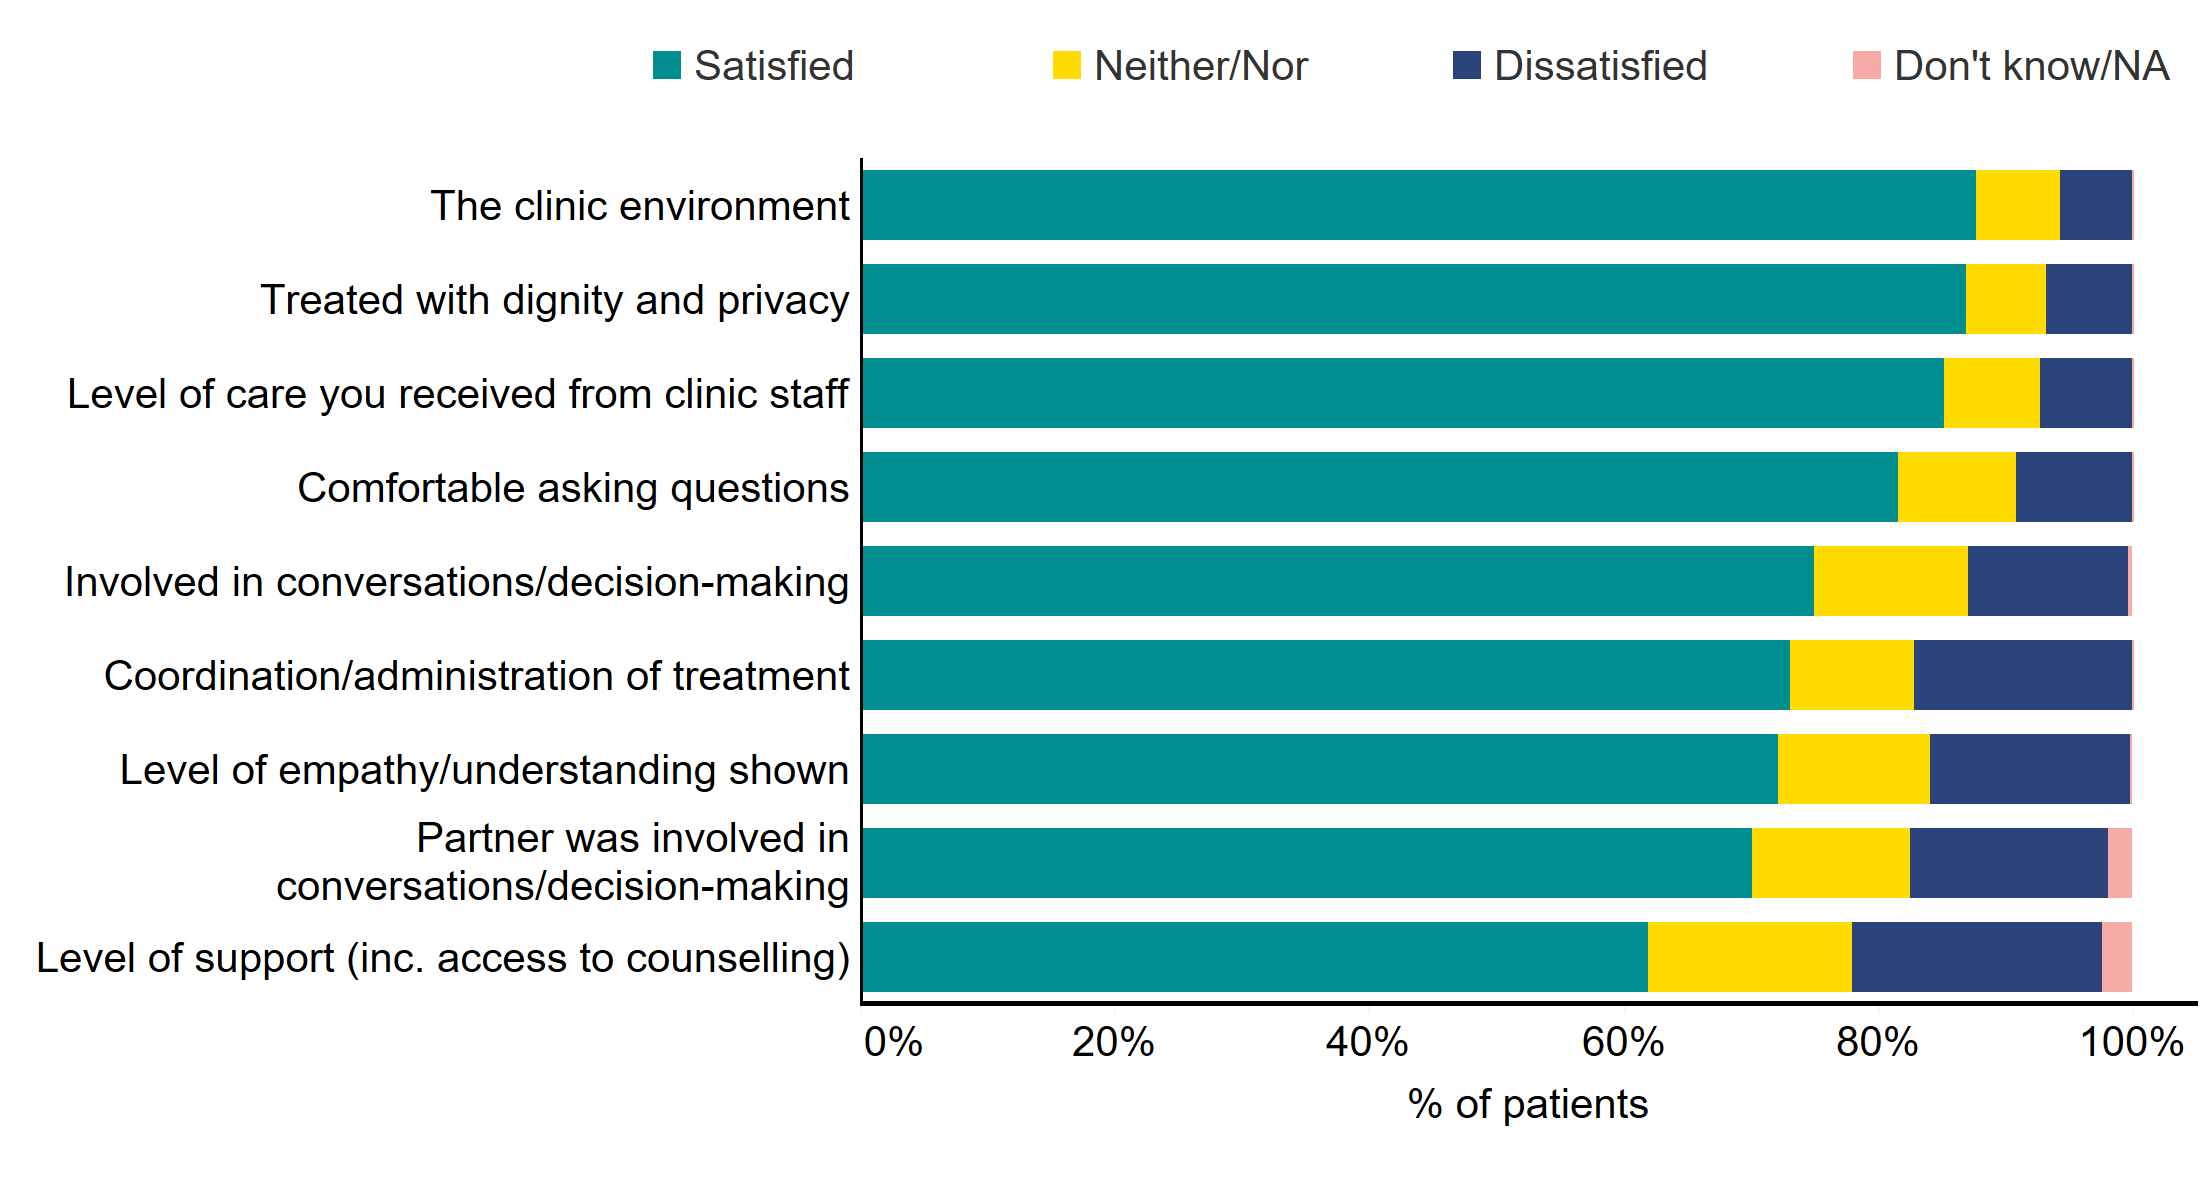
Q: ‘How satisfied or dissatisfied were you with …? (N=1,233)
**Patients without partners excluded from ‘Partner involved in conversations/decision-making’
Download the underlying data for Figure 2 as Excel Worksheet.
Satisfaction was generally very similar between those whose recent treatment was NHS-funded or privately funded. However, there were a few areas where NHS-funded patients were less satisfied, including ‘feeling involved in conversations and decision-making’ (70% NHS vs. 78% private), with their partner being involved in conversations/decision-making (67% NHS vs. 72% private), and with the clinic environment (84% NHS vs. 89% private).
Most of these aspects of patient experience have improved or stayed the same since 2018. However, satisfaction with partner involvement in conversations and decision-making has declined since 2018, down from 81% to 70%. This decline may be due to the COVID-19 pandemic, where many clinics restricted partner access to clinic appointments to decrease clinic occupancy.
Looking at the free text responses for those dissatisfied with treatment, it was clear that many patients were dissatisfied with the cost of treatment, with not being treated as an individual, or being treated with a lack of compassion. Some had also encountered staff rudeness, with several complaints about the administration/coordination of care.
“Costs were not made clear - we were given a menu of costs but we were billed as we went along and it ended up being considerably more expensive than anticipated”
“We were not treated as individuals and a care plan was not discussed with us. There seemed to be a lot of assumptions made by clinical staff and the consultants had no empathy or compassion at all”
“Admin staff were generally very rude…the administration and coordination was terrible with conflicting information depending on who you spoke to and I came across very rude admin staff at reception when I questioned the conflicting information.”
In addition, many same-sex couples were also dissatisfied with the cost of treatment, as well as how they were treated throughout their fertility journey, from early chats with GPs where they felt dismissed, to receiving treatment.
The whole process as a gay couple has been demoralising and upsetting, from the cost of the treatment, to the disorganisation of the clinic and lack of clarity around a 'shared motherhood' cost package”.
2.3. Clarity of information
In terms of the information provided to patients prior to treatment starting, consent forms for treatment were particularly clear (93%), followed by the clarity of the treatment plan (83%), and what to do if there were medical issues or emergencies (79%). Three-quarters (77%) also felt that the health risks of treatment had been made clear to them. Each of these aspects were also clearer than in 2018 (up from 85%, 81%, 79%, and 73% respectively). Four in five private patients (81%) also said that the total costs of their treatment had been clear. However, as indicated by some of the free-text responses highlighted above, one in five (19%) felt costs to be unclear.
Three-quarters (76%) of patients said that the availability of counselling had been clearly communicated to them (higher than those satisfied with counselling above), however fewer (68%) agreed that their own chance of success had been made clear. Clarity on personal chance of success has declined since 2018 (down from 76%)3. The HFEA Code of Practice contains a number of requirements for information that patients must be given prior to starting treatment, with personal chance of success one of them, so this is lower than we would have expected.
Clarity of communication by clinics prior to treatment starting

Q: ‘To what extent, if at all, were each of the following aspects clearly communicated to you or your partner by the clinic before treatment was agreed? (N=1,233)
**NHS funded patients excluded for ‘The total costs of your treatment’
Download the underlying data for Figure 3 as Excel Worksheet.
There were few differences between recent NHS-funded and privately funded patients on these aspects, although privately funded patients were more likely than NHS-funded patients to say that the clinic had clearly communicated their own chance of success. Older patients aged 43+ were also more likely to agree that the clinic clearly communicated their own chance of success (80%*), along with those with no partner (77%*).
3. Experience of speaking to a GP about fertility concerns
3.1. Speaking to a GP
Four in five patients (78%) spoke to a GP prior to starting treatment – unchanged since 2018. Those who had spoken to a GP generally did so one to two years after first trying to conceive (49%), with a quarter doing so within a year (27%). However, 8% waited over three years.
Those under 37 are more likely to have spoken to their GP sooner (under two years) than those aged 38+ (78% vs. 71%*). In addition, White patients are also more likely than Black, Asian, Mixed or Other ethnicity patients to have spoken to their GP earlier (77% vs. 72% for under two years*), similar to findings from our Ethnic Diversity in Fertility Treatment report.
As Figure 4 shows, the main reasons reported for waiting to speak to a GP were: they thought it could take a while to conceive (37%); they first tried to conceive naturally for 1-2 years (26%), or they were in denial that there might be a problem (23%). Because of the timing of the survey, 9% cited delays due to COVID-19 (rising to 11% among those treated in the past 2 years).
Reasons for wait to speak to a GP about fertility concerns
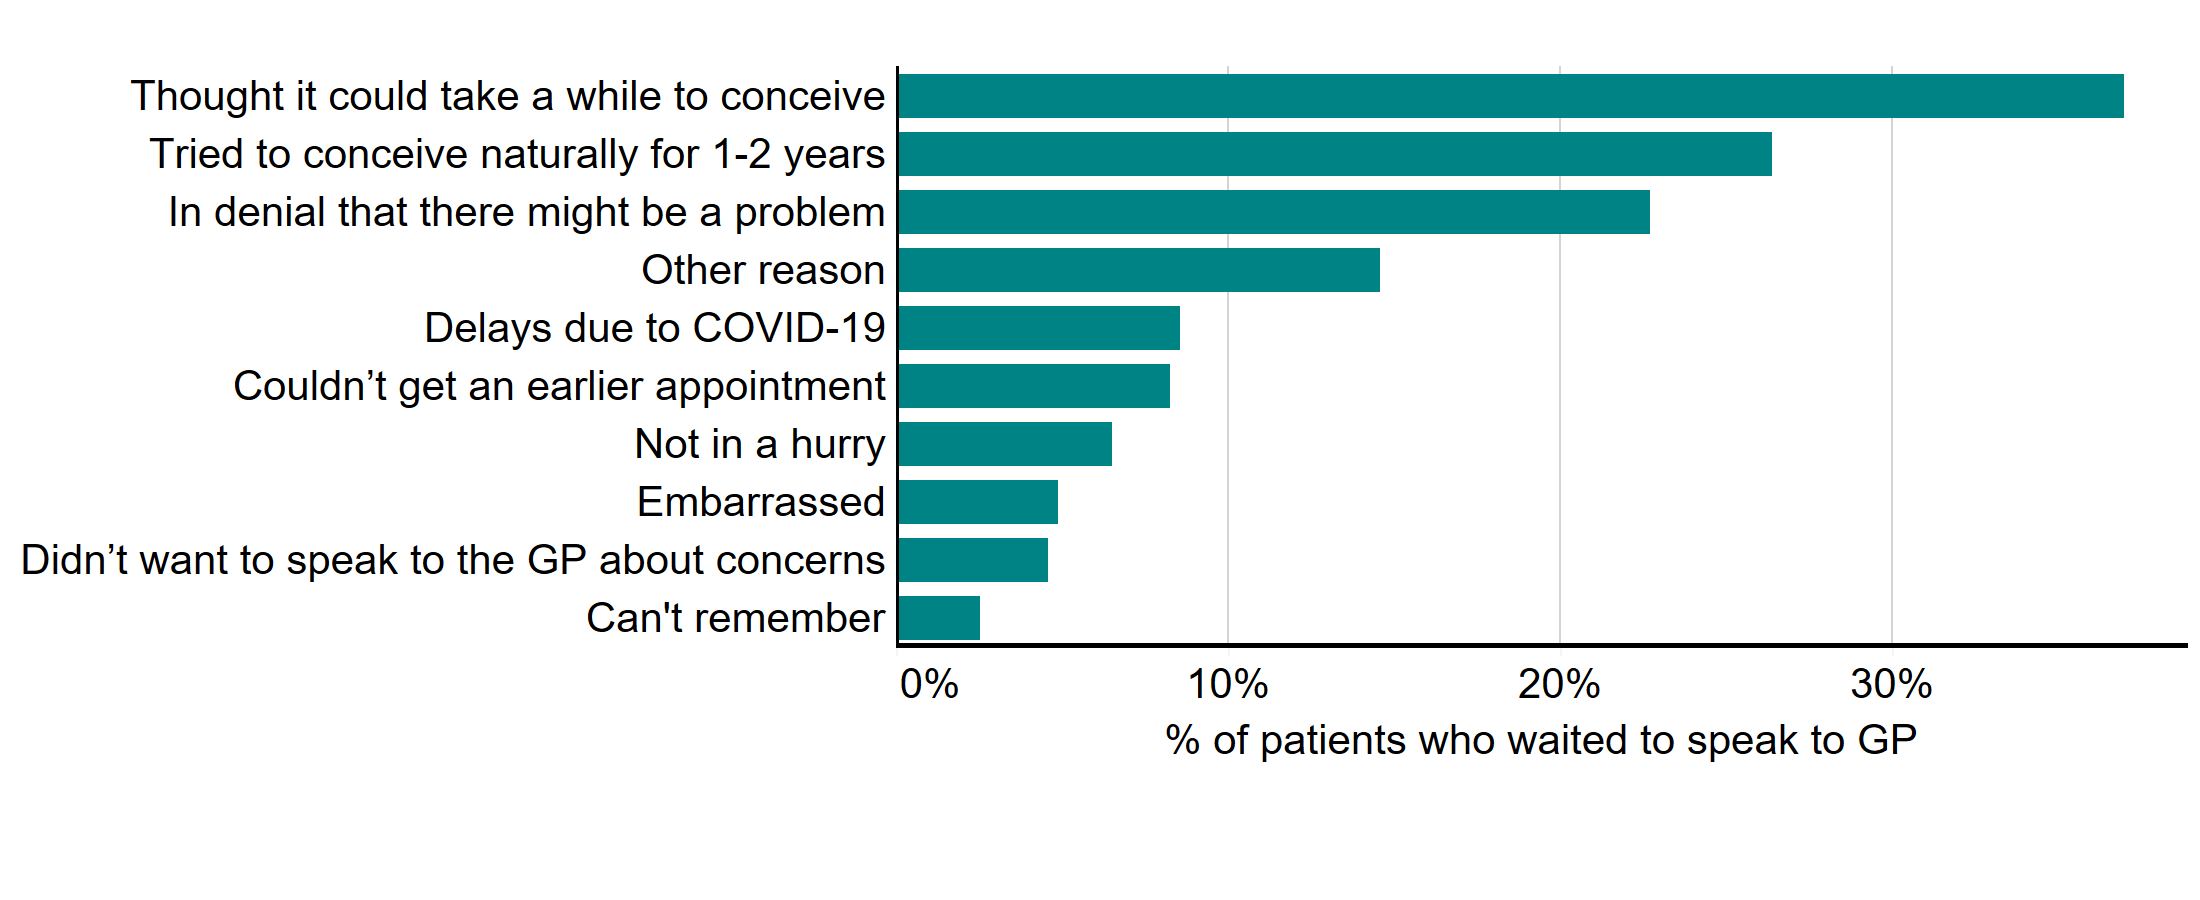
Q: ‘Which of the following reasons, if any, explain your wait to speak to a GP to discuss your options? Please select all that apply’ (Multi code). The data is filtered on those who spoke to a GP, with ‘Not applicable’ responses to this question and Q2a removed. Only top answers shown in the chart, (N=678).
Download the underlying data for Figure 4 as Excel Worksheet.
Of the two in five (22%) who didn’t speak to a GP to discuss their options, the main reasons for not doing so were that the clinic didn’t require it (36%); there was no known fertility issues (23%, largely female same-sex couples or those with no partner); and they did not want to wait (22%).
3.2. Satisfaction with GP
Less than half (47%) were satisfied with their experience of speaking to a GP, and a third (32%) were dissatisfied. Satisfaction with GP experience has decreased since 2018, where 56% of patients were satisfied.
As Table 1 illustrates, satisfaction was highest among those with shorter waits (0-6 months) prior to starting treatment (56% vs. 40% for 18+ months), along with those whose treatment had led to a live birth or were currently pregnant (53% vs. 31%). Those who experienced delays due to not being referred sooner, or due to COVID-19 delays also appear to be more dissatisfied.
Additionally, those who had only ever had private treatment were more likely to be dissatisfied than those who had only ever had NHS-funded treatment (44% vs. 24%). Female same sex couples were more dissatisfied than those with a male partner (44% vs. 31% with male partner*).
Table 1. NHS-funded patients, those with shorter waits to start treatment, and those whose treatment had led to a live birth were most likely to report they were satisfied
Satisfaction with GP by subgroup
|
|
Total |
0-6 month |
18+ months wait |
Live birth/ currently pregnant |
Not yet led to live birth |
NHS funded only |
Private funded only |
Male partner |
Female partner |
|
Satisfied |
47% |
56% |
40% |
53% |
31% |
58% |
33% |
49%* |
33%* |
|
Dissatisfied |
32% |
26% |
42% |
39% |
46% |
24% |
44% |
31%* |
44%* |
Q: ‘Overall, how satisfied or dissatisfied were you with your experience of speaking to your GP to discuss your options? (N=1,233)
Looking at the free text responses, reasons for dissatisfaction with speaking to a GP generally related to feeling ignored or being treated with a lack of empathy. Frustration around waiting times (for investigations or surgeries) and, more generally, waiting lists for NHS treatment also led to feelings of resentment, as the quotes below illustrate.
“Completely fobbed us off. I had to return 3 times before I was referred”
“The GP kept forgetting to refer us…This happened a few times, costing me what I believed to valuable time for my fertility in my mid-thirties”
“My first GP was very unempathetic, just told me to keep trying for 2 years despite guidelines indicating otherwise”
“GP didn't know how to interpret the results and kept telling us to keep trying naturally. When we eventually went to a gynaecologist, she found I had suspected polycystic ovary syndrome (PCOS) and wasn't ovulating”
“Waiting lists for hystopingogram/sonogram were months and months between and couldn’t get referred for NHS treatment without investigations first”
3.3. Starting treatment
After speaking to the GP, it was generally another 6-18 months before treatment started (51%), with 15% starting within six months. However, about a quarter (28%) waited over 18 months.
Those who had only ever had NHS-funded treatment were more likely to wait more than 18 months before starting treatment than those who had only ever had private treatment (34% vs. 23%*), along with Black, Asian, Mixed and Other ethnicity patients (32% vs. 27% of White patients*). However, those aged 38+ were more likely to begin treatment within 6 months than those under 37 (18% vs. 14%*).
As Table 2 shows, around two in five (38%) experienced a delay in starting treatment due to having to wait for further tests or surgery. The same proportion (38%) had to wait for NHS treatment, whilst one in five (22%) said there was a delay in referrals due to COVID-19 (rising to 28% amongst those treated in the past 2 years). Slightly fewer (18%) stated that the GP didn’t refer them at first, with 14% advised to keep trying naturally.
Table 2. Further tests or surgery, waiting lists and delays in referrals led to delays in starting treatment
Reasons for wait to start treatment after speaking to GP
|
Main reasons for wait to start treatment |
All |
NHS funding only |
Private funding only |
|
On the waiting list for NHS treatment |
38% |
48% |
18% |
|
Further tests or surgery |
38% |
41% |
31% |
|
Delays in referrals due to COVID-19 |
22% |
32% |
18% |
|
The GP did not refer me/us at first |
18% |
17% |
21% |
|
Advised to keep trying naturally for longer |
14% |
14% |
14% |
|
Needed to build up finances |
10% |
0% |
25% |
Q: ‘Could you tell us the reason(s) for any delay in starting treatment after speaking to your GP? Please select all that apply’ (Multi code), (N=926). The data is filtered on those who spoke to a GP, with ‘Not applicable’ responses at Q2c removed. Reasons below 10% have been excluded from the table but are available in the underlying data.
Reasons for waiting to start treatment varied between NHS-funded and privately funded patients. Looking at those who had only ever had private treatment, the main reason they waited was due to having further tests or surgery (31%), having to build up finances (25%), and not being referred by the GP at first (21%). They were also more likely to say it took time to find the right clinic/consider options (11%).
For NHS-funded patients, the main reasons were waiting lists for NHS treatment (48%), waits for further tests/surgeries (41%) and delays in referrals due to COVID-19 (32%), which rose to 41% among those treated in the past two years.
4. Multiple embryo transfers
4.1. Profile and reasons for doing so
The HFEA has worked for many years with clinics and professional bodies to reduce the multiple birth rate as multiple births have been one of the biggest health risks of fertility treatment.
Three in ten patients (30%) had received a multiple embryo transfer during any of their treatments, with those doing so tending to be older, with almost half (46%) aged 38+ (vs. 22% of under 37s). Patients who had received a multiple embryo transfer also tended to have had more than one cycle, with almost two in five (38%) having had four+ cycles (vs. 16% who had just one), and to be privately funded patients (42% vs 21% NHS-funded only patients).
There was also a trend with Black, Asian, Mixed or Other ethnicity patients more likely to have had a multiple embryo transfer than White patients (38% vs. 29%), similar to findings from our Ethnic Diversity in Fertility Treatment report.
Patients who had multiple embryo transfers tended to do so on clinic advice, with half (51%) doing so because of age and/or previous unsuccessful cycles, with those aged 40+ more likely to say this was the case (72% vs. 29% of under 35’s). A third of those who had a multiple embryo transfer (32%) did so because of low ovarian reserve or low-quality embryos, with those under 35 more likely to say this was the case (37%).
However, some patients did ask for a multiple embryo transfer. A third (32%) asked for this to increase their chances of getting pregnant, and 6% asked for a multiple transfer as they wanted to have multiples. For more information on how single or multiple embryo transfers impact on the risk of multiple births, please see our Multiple births in fertility treatment report.
Reasons for having a multiple embryo transfer
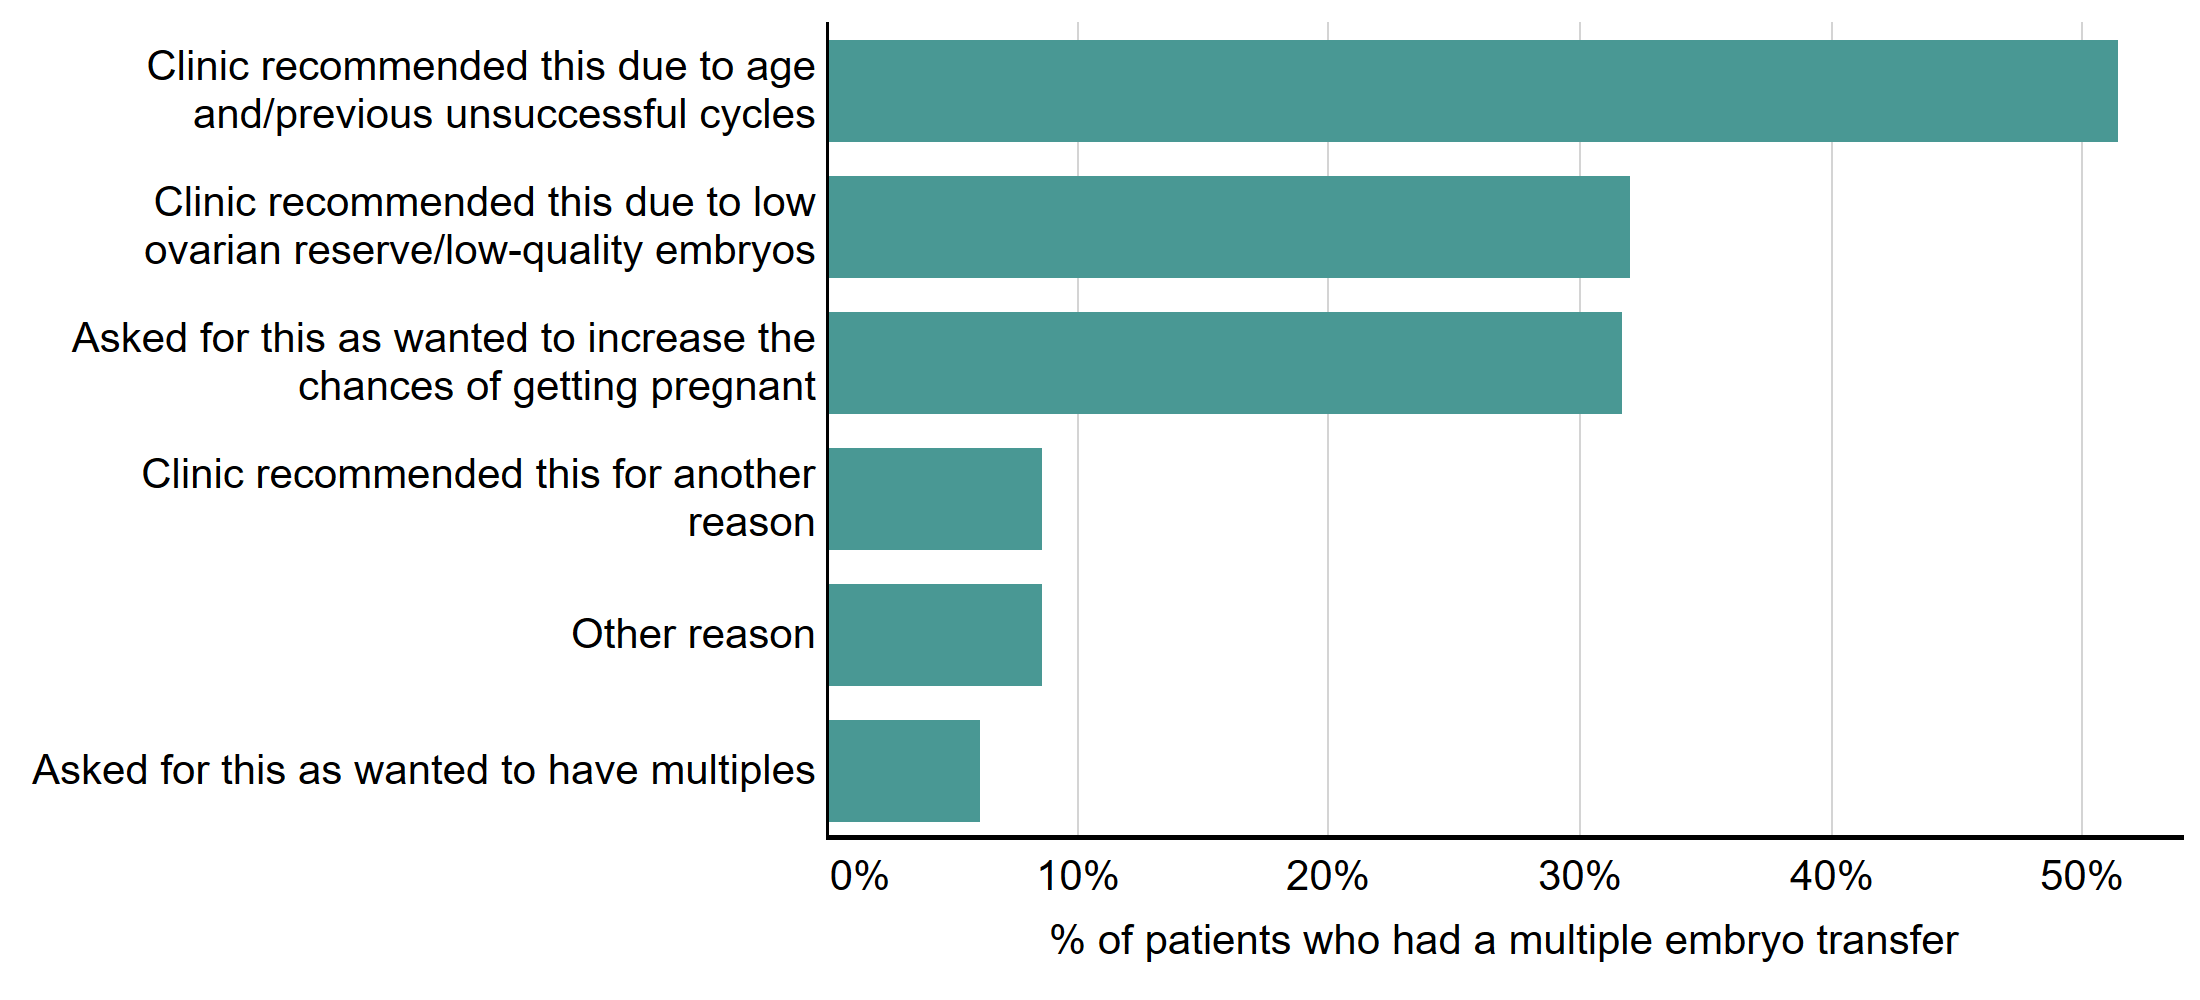
Q: ‘Can you tell us why the decision was taken to transfer more than one embryo? Please select all that apply’, (multi code). The data is filtered on those who have had more than one embryo transferred in treatment (N=325).
Download the underlying data for Figure 5 as Excel Worksheet.
Those aged 35-39 were more likely to ask for a multiple embryo transfer to increase their chances of getting pregnant (36% vs. 28% of under 35’s*), along with private patients (36% vs 26% NHS-funded only*), and those who had previously had at least one cycle.
4.2. Explanation of risks
Multiple births cause increased risk of health problems for patients and their babies, including late miscarriage, premature delivery, gestational diabetes, still birth and neonatal and maternal death.
Three-quarters of patients (75%) agreed that the clinic explained the chances of a multiple pregnancy with them, and around seven in ten (69%) agreed that the clinic discussed the risks associated with multiple births.
Slightly fewer (66%), agreed that they were given enough information to make an informed decision, or that they were given enough time to consider the options (61%). Two-thirds (67%) said that they would make the same decision again. Those who were now pregnant, or who had a child as a result of treatment, were more likely to agree that they would make the same decision again (54% vs. 40% of those whose treatment had not yet resulted in a live birth*).
However, fewer (61%) agreed that the clinic discussed their own individual risk (based on health/age/ethnicity). Those aged 40-42 (68%*), along with Black, Asian, Mixed and Other ethnicity patients (65%*) were more likely to say that the clinic discussed their own individual risk.
Statements relating to multiple embryo transfers

Q: ‘To what extent do you agree or disagree with the following statements in relation to your decision on how many embryos to transfer?’. The data is filtered on those who have had IVF (N=1,098).
Download the underlying data for Figure 6 as Excel Worksheet.
5. Use of donor eggs, sperm, or embryos
5.1. Use and ease of access
Around three in ten (28%) had used donated eggs, sperm or embryos, with donated sperm being the most common. Around a quarter (23%) would consider using donated gametes if required, but a quarter (26%) said they would not consider using them.
Of those who had used donated eggs, sperm or embryos, two-thirds (65%) said they found them easy to access, with donor sperm easiest (65%). A quarter (25%) found them difficult to access, with those who had treatment in the past two years more likely to say it was difficult (30%).
Half (50%) of those using donor gametes were treated in the UK using gametes organised through the clinic or donor egg/sperm bank, and almost two in five (37%) were treated in the UK using gametes imported from abroad. Just 5% went abroad for treatment4. Those who found it easy to access gametes were more likely to have accessed gametes through a clinic, whereas those finding it difficult were more likely to have imported gametes from abroad.
5.2. Donor waiting times
Half of those who had used donor gametes (53%) said there was no wait. A quarter waited less than three months (25%), and one in ten (12%) waited 3-6 months. However, 5% waited over a year.
Those using donor sperm were more likely to say there had been no wait (63%), with the wait longest for donor eggs and embryos, although base sizes for both are small, so indicative only. Waits do also appear to be longer for Black, Asian, Mixed and Other ethnicity patients, although again, due to small base sizes this is also indicative. Table 3 shows the wait times by gamete type, although due to small numbers, the data for donated eggs, eggs and sperm, and embryos have been combined.
Table 3. Wait times for donor eggs were higher than for donor sperm
Wait times for donor eggs/embryos/sperm by type
|
|
Total (N=319) |
Eggs, Eggs & Sperm, Embryos (N=81)* |
Sperm (N=238) |
|
No wait |
53% |
23% |
63% |
|
Less than 3 months |
25% |
27% |
24% |
|
3-6 months |
12% |
22% |
9% |
|
6-9 months |
3% |
11% |
0% |
|
9-12 months |
2% |
4% |
1% |
|
Over a year |
5% |
12% |
3% |
Q: ‘From the point at which you decided to use donated eggs, sperm or embryos, how long did you have to wait before you were matched with a donor? The data is filtered on those who have used donor eggs/sperm/embryos in treatment with 'Not applicable' responses at Q15b removed (N=319).
The main reason for the wait was generally a lack of available eggs, sperm or embryos (44%). However, three in ten (29%) said that there was a lack of donor gametes meeting their criteria, which appears to be higher amongst Black, Asian, Mixed and Other ethnicity patients, although this was also indicative due to small numbers.
5.3. Importance of matching ethnicity
Four in five patients who had used donor gametes (82%) said it was important that the donor’s ethnicity matched their own. This was particularly important for White patients (84%), which may be due to shorter waits and more availability of gametes of matching ethnicity.
However, fewer (75%) felt it was important that the donor’s ethnicity matched their partner’s. Three-quarters (78%) felt it was important that there was information about the donor, or that the donor looked similar (74%). Three in five (63%) also thought it was important that the donor was identifiable when the child turned 18.
Importance of various aspects when choosing donor gametes
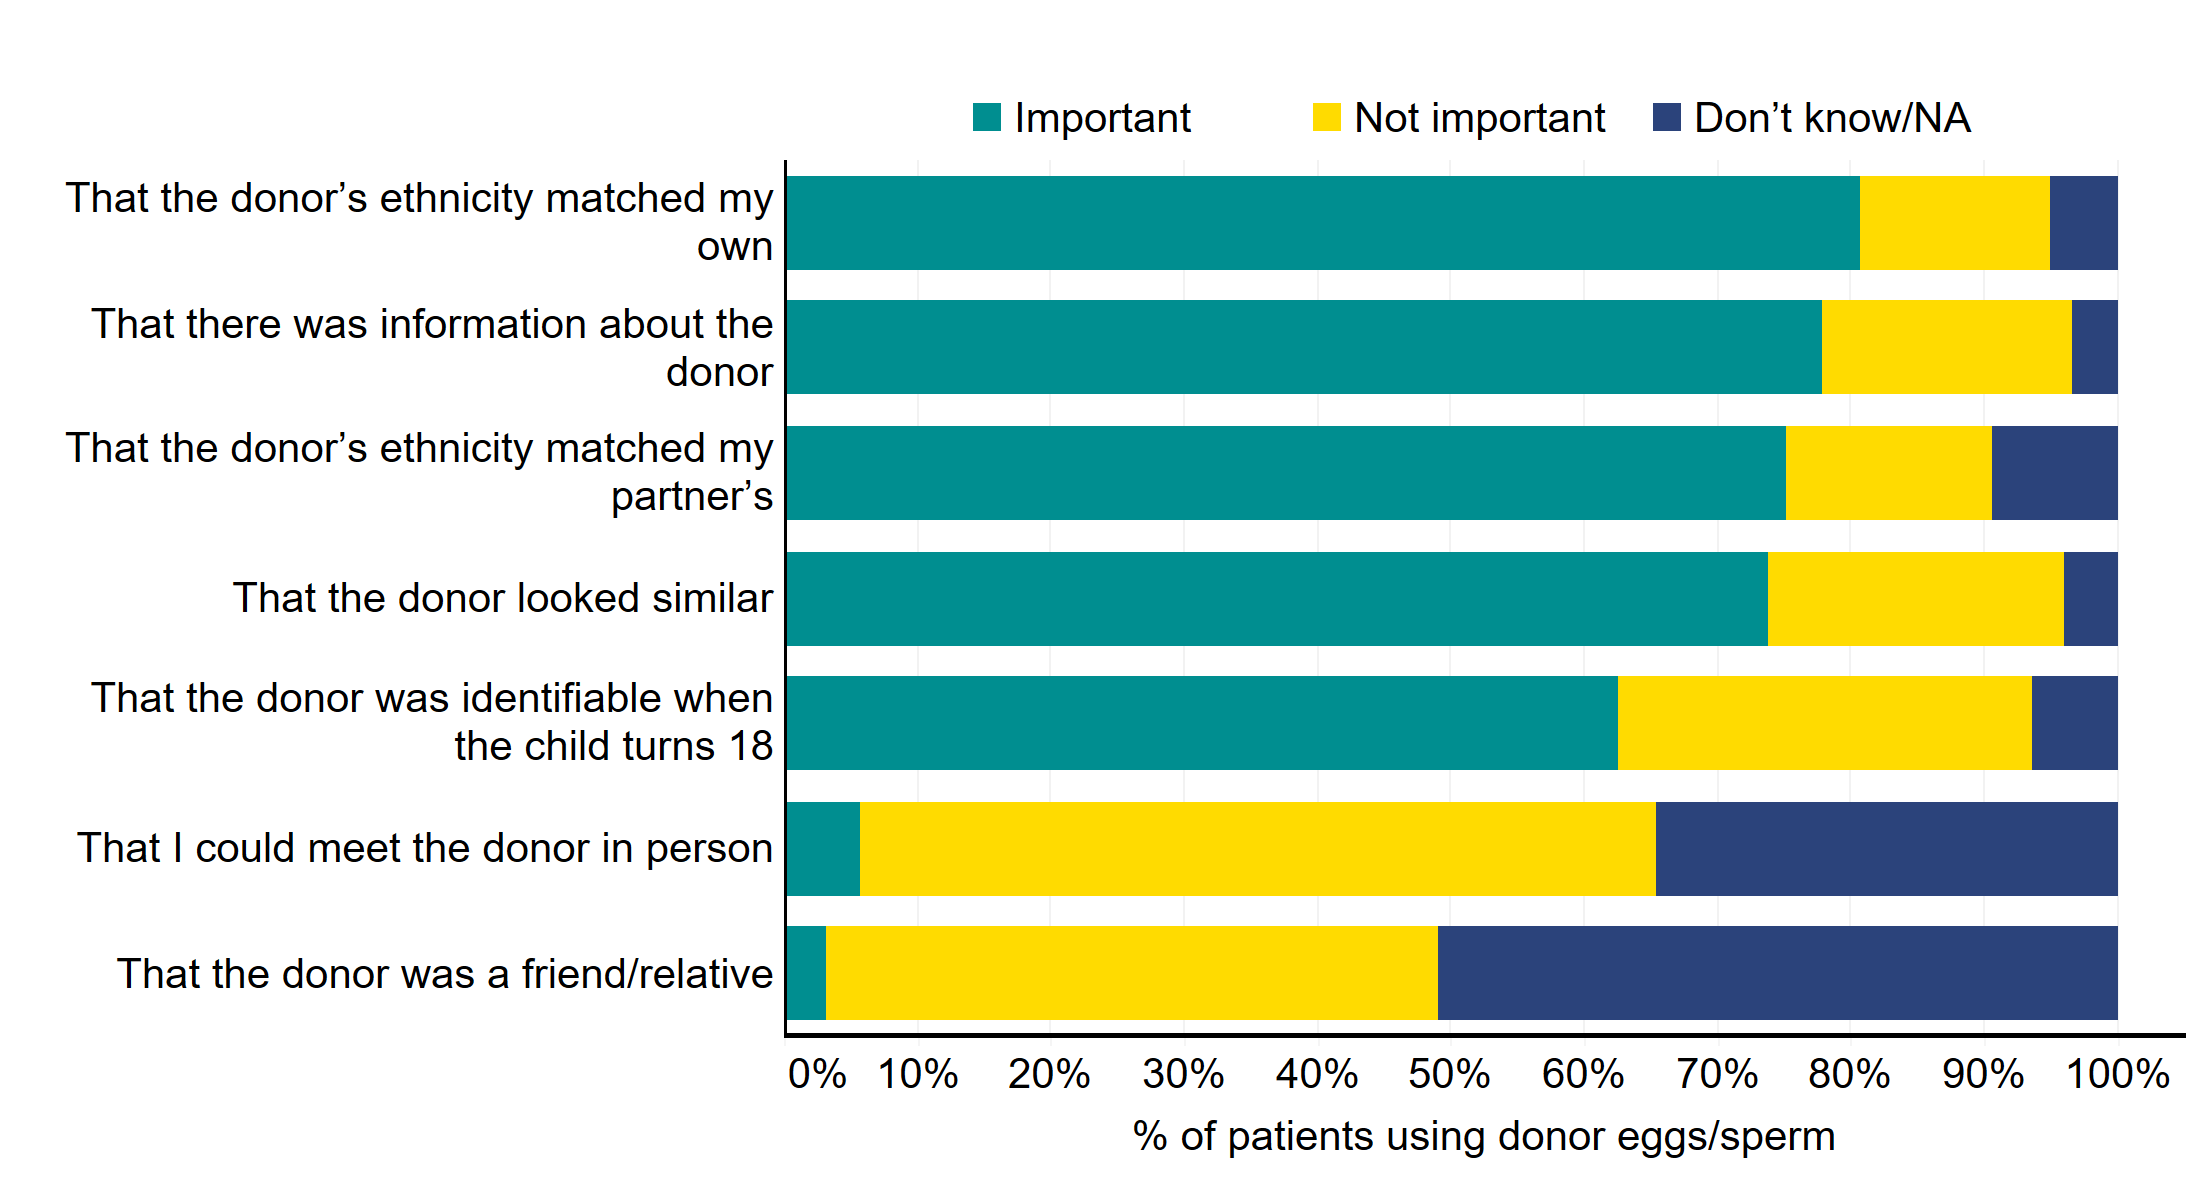
Q: ‘How important, if at all, were the following when choosing donated eggs, sperm or embryos?’. The data is filtered on those who have used donor eggs/sperm/embryos in treatment (N=347)
Download the underlying data for Figure 7 as Excel Worksheet.
A quarter of patients would not consider using donor gametes (26%), which was largely because a genetic link was important to them or their partner (53%). Many also felt they did not need to use them (37%) – largely the under 35’s. One in five (21%) said that a genetic link was important to their family or to their culture, or that using donor gametes was against their, or their partners, religious beliefs. Around one in ten (12%) said that they had not thought about using donor gametes, with five percent saying they would prefer to foster or adopt.
6. Treatment add-ons
6.1. Use of add-ons
Since 2017, the HFEA has worked to reduce the use of add-ons in treatment, since most remain unproven at increasing the chance of having a live birth for most fertility patients. It was positive that their use has declined, with a third (35%) having never used an add-on in treatment, up from 29% in 2018.
Three-fifths of patients (65%) had used a treatment add-on during treatment. Acupuncture was the most common add-on, used by a third (33%) of patients – up from 23% in 2018.
The next most common add-on was time-lapse imaging (for example, embryoscope), which was used by a quarter (27%). This has also increased from 2018 (rising from 19% in 2018 to 27% in 2021). Neither acupuncture or time-lapse imaging are considered a risk to patient health, and many clinics are now offering time-lapse imaging for free, which may explain the increase.
Use of treatment add-ons, 2018 vs. 2021

Q: ‘In relation to fertility treatment, have you or your partner had any of the following additional treatments (often known as treatment add-ons)? Please tick all that apply. Multi code’ (N=1,233)
Download the underlying data for Figure 8 as Excel Worksheet.
Most add-ons are more commonly used by privately funded patients, particularly acupuncture (35% vs. 26% of NHS-funded patients), time-lapse imaging (30% vs. 16% of NHS-funded patients), hyaluronate enriched medium (commonly known as ‘embryo glue’ (16% vs. of 11% NHS-funded patients), endometrial scratch (14% vs. of 9% NHS-funded patients) and immunological tests (11% vs. 3% of NHS-funded patients).
Some add-ons can be expensive, and those using pre-implantation genetic testing for aneuploidy (PGT-A) are less likely than private patients overall to say that costs matched up to what was proposed at the start of treatment (74% vs. 85% of private patients overall*).
Black, Asian, Mixed or Other ethnicity patients are also more likely to have used ‘red’ add-ons than White patients (41% vs. 24%). A red add-on is where, according to the HFEA traffic light system, there is no evidence from randomised control trials (RCTs) that it is effective at improving the chances of having a baby for most fertility patients, so this is concerning.
6.2. Clarity and explanation of risks
Before treatment add-ons are used, it is important that clinics provide clarity on the reasons for their use, an explanation of any risks, and details of the cost.
Of those using a treatment add-on, less than half (46%) felt that the cost of the add-on was clear, or that the clinic explained how effective the add-on was likely to be at increasing the chances of having a baby or the evidence supporting its use (46%). A third (34%) of patients had read the information on the HFEA website regarding add-ons.
However, of more concern, just a third (33%) said that the clinic had explained the potential risk(s) of the add-on. Patients who received assisted hatching, PGT-A, or elective freeze-all cycles are less likely to report that risks had been explained (11%, 19% and 22% respectively*).
7. Knowledge of HFEA & Information/support sources
7.1. Familiarity with the HFEA
We asked patients about whether they knew about the HFEA and the information we provide. Three in five (60%) were familiar with the HFEA, with one in five (19%) not very familiar. This was down from 2018, where familiarity was 68%. However, this may have been affected by survey bias previously, since in 2018 it was positioned later in the questionnaire.
Generally, awareness was similar across all subgroups, although Black, Asian, Mixed and Other ethnicity patients are slightly less likely to be familiar with the HFEA (57%*).
Familiarity with the HFEA, 2018 vs. 2021
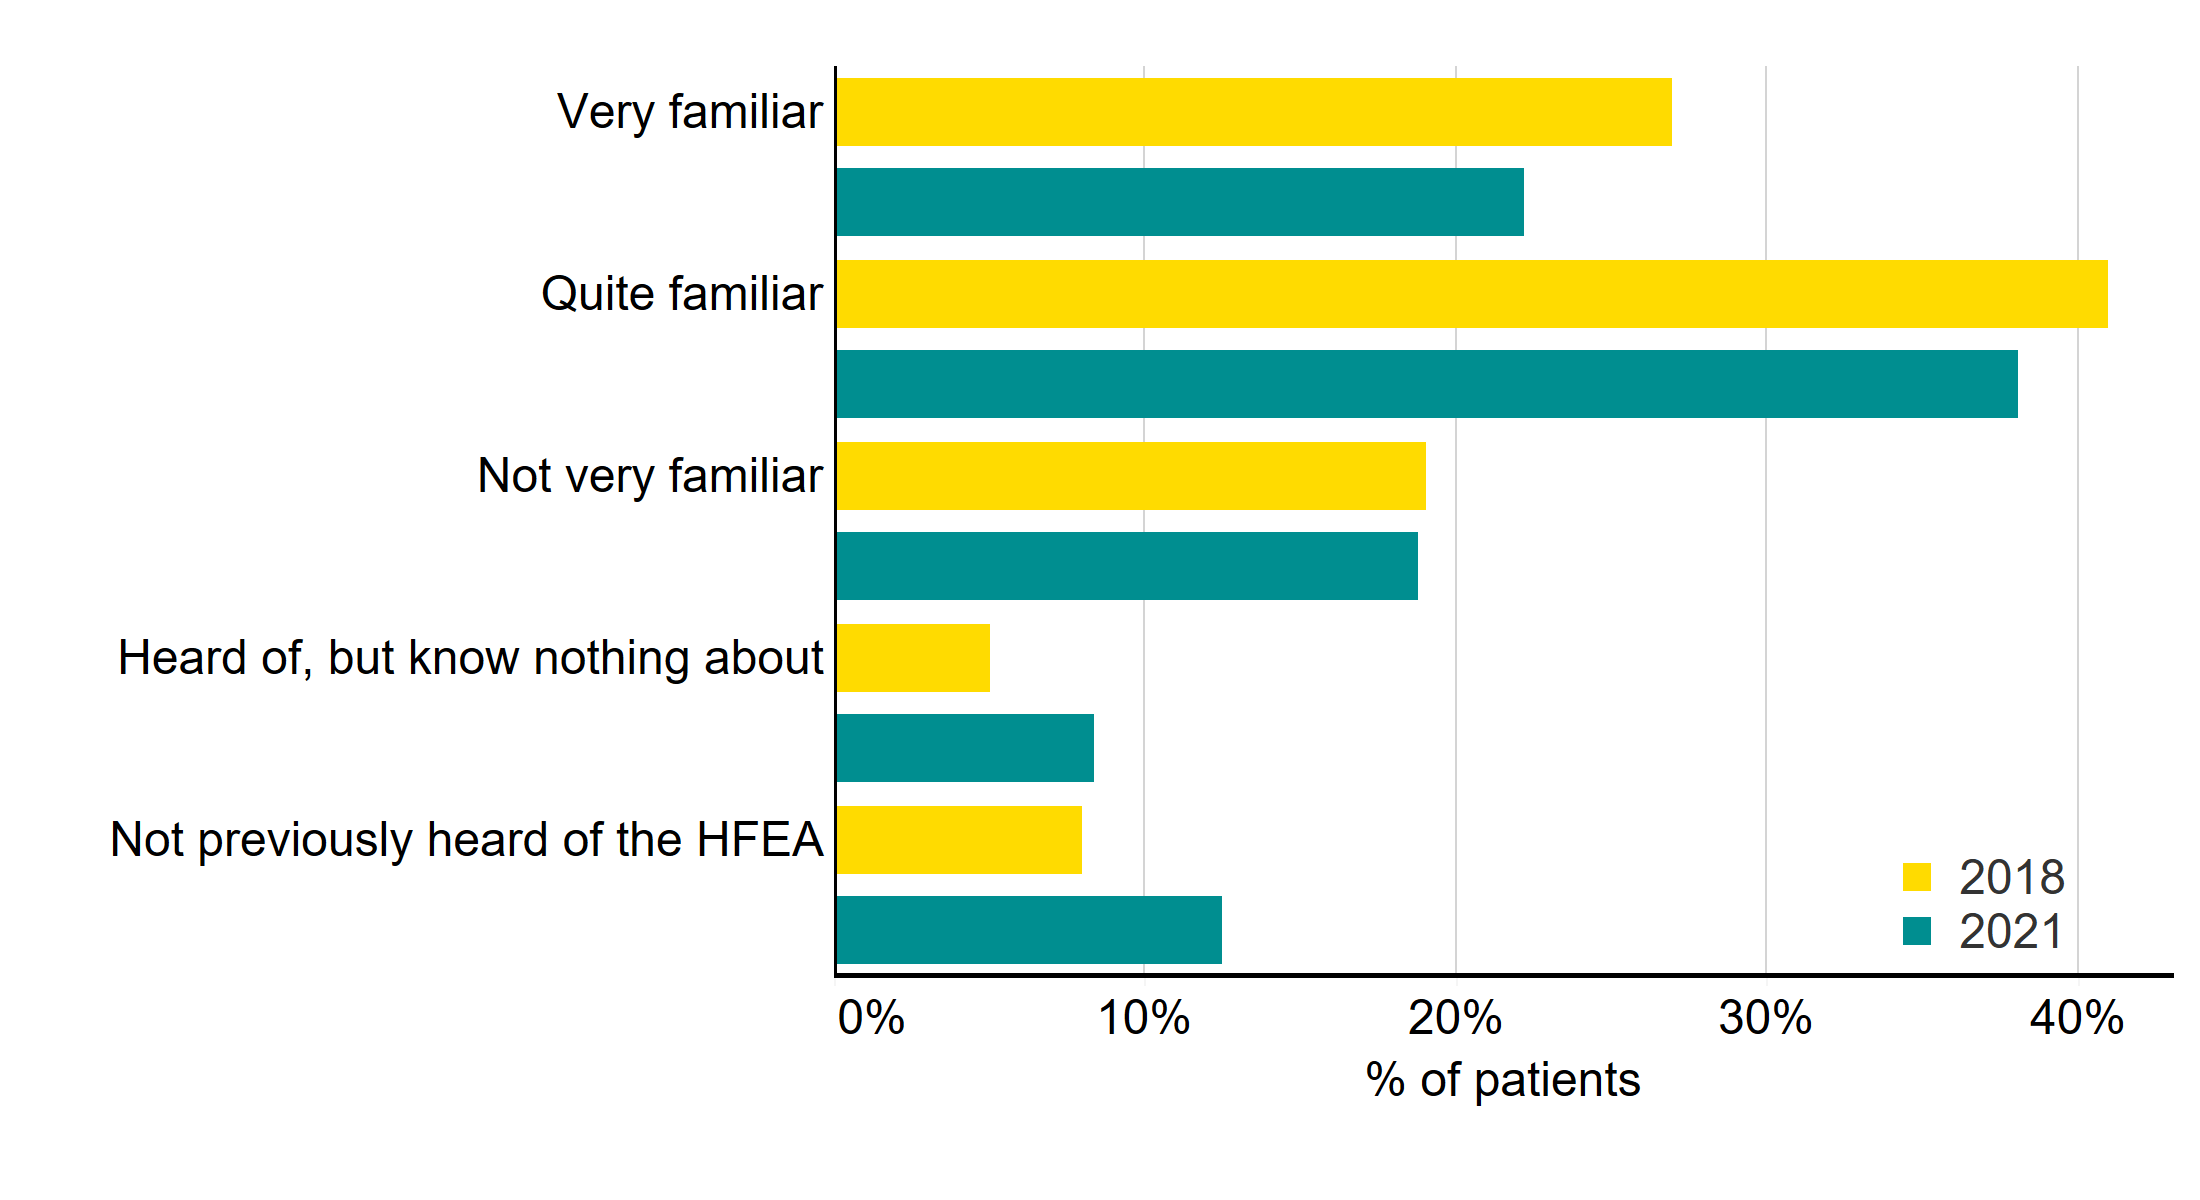
Q: ‘Before this survey, how familiar were you with the Human Fertilisation and Embryology Authority (HFEA)?’ (N=1,233)
Download the underlying data for Figure 9 as Excel Worksheet.
7.2. Information/support sources used
The top sources of information and support sources used by patients were clinic websites (73%), search engines (71%), and social network sites (64%). Online forums were also used by over half (56%), with the same proportion using the HFEA website to find information or support (55%, up from 41% in 2018).
Comparing results with 2018, most information/support sources have increased, especially use of charities (up from 7% to 37%), social network sites (up from 16% to 64%), online forums (up from 33% to 56%), and clinic websites (up from 49% to 73%). However, use of the GP as a source of information/support has decreased (down from 43% to 31%). It’s important to bear in mind that in 2018 patients were asked to reflect on ‘when they first thought of treatment’, whereas this time the question was more general.
Information/support sources used – 2018 vs. 2021

Q: ‘Which, if any, of the following have you or your partner used to find information/support about fertility treatment? Please tick all that apply? (Multi code). Only the top sources are shown in the chart (N=1,233).
Download the underlying data for Figure 10 as Excel Worksheet.
Looking at subgroup differences, age is an important differentiator, with younger patients most likely to use social media and podcasts, and less likely to use the HFEA website. Use of the HFEA website tended to increase the more cycles a patient had undergone.
Patients who hadn’t used the HFEA website were not aware that information about clinics, IVF or add-ons was available on the HFEA website (43%), with around three in ten (33%) saying that they had not heard of the HFEA. One in five (20%) also said that they may have looked at the site, but could not remember, or that they got the information they were looking for from another source (17%).
The majority of free text answers related to the HFEA suggested a good understanding of the role of the HFEA in ‘regulating clinics/fertility treatments’; ‘setting and enforcing standards’; and ‘providing information/advice on treatments and/or clinics’.
7.3. Top factors when choosing a clinic
The top five most important factors when choosing a clinic were location (59%), success rates (53%), a good first impression of the clinic/staff (36%), treatment options offered (28%) and cost (26%). However, around a quarter had no choice on clinic (28%). This chimes with what the Competition and Markets Authority (CMA) found in their recent research with fertility patients, which can be found here.
In 2018, location (50%) was still the most important factor, followed by information about success rates (41%), a good first impression of clinic staff (33%), treatment options offered (29%) and recommendations from family and friends (19%). Cost was cited by just 18%.
In fact, since 2018, each of these factors have become more important, particularly success rates (+12%), location (+9%), and cost (+8%5).
Each of these factors (location, success rates, first impression, treatment options and cost) are most important to private patients, since they have more choice over which clinic they can attend. However, the most important factors for NHS patients were still location and success rates (11% and 9%).
Most important factors when choosing a clinic, 2018 vs. 2021
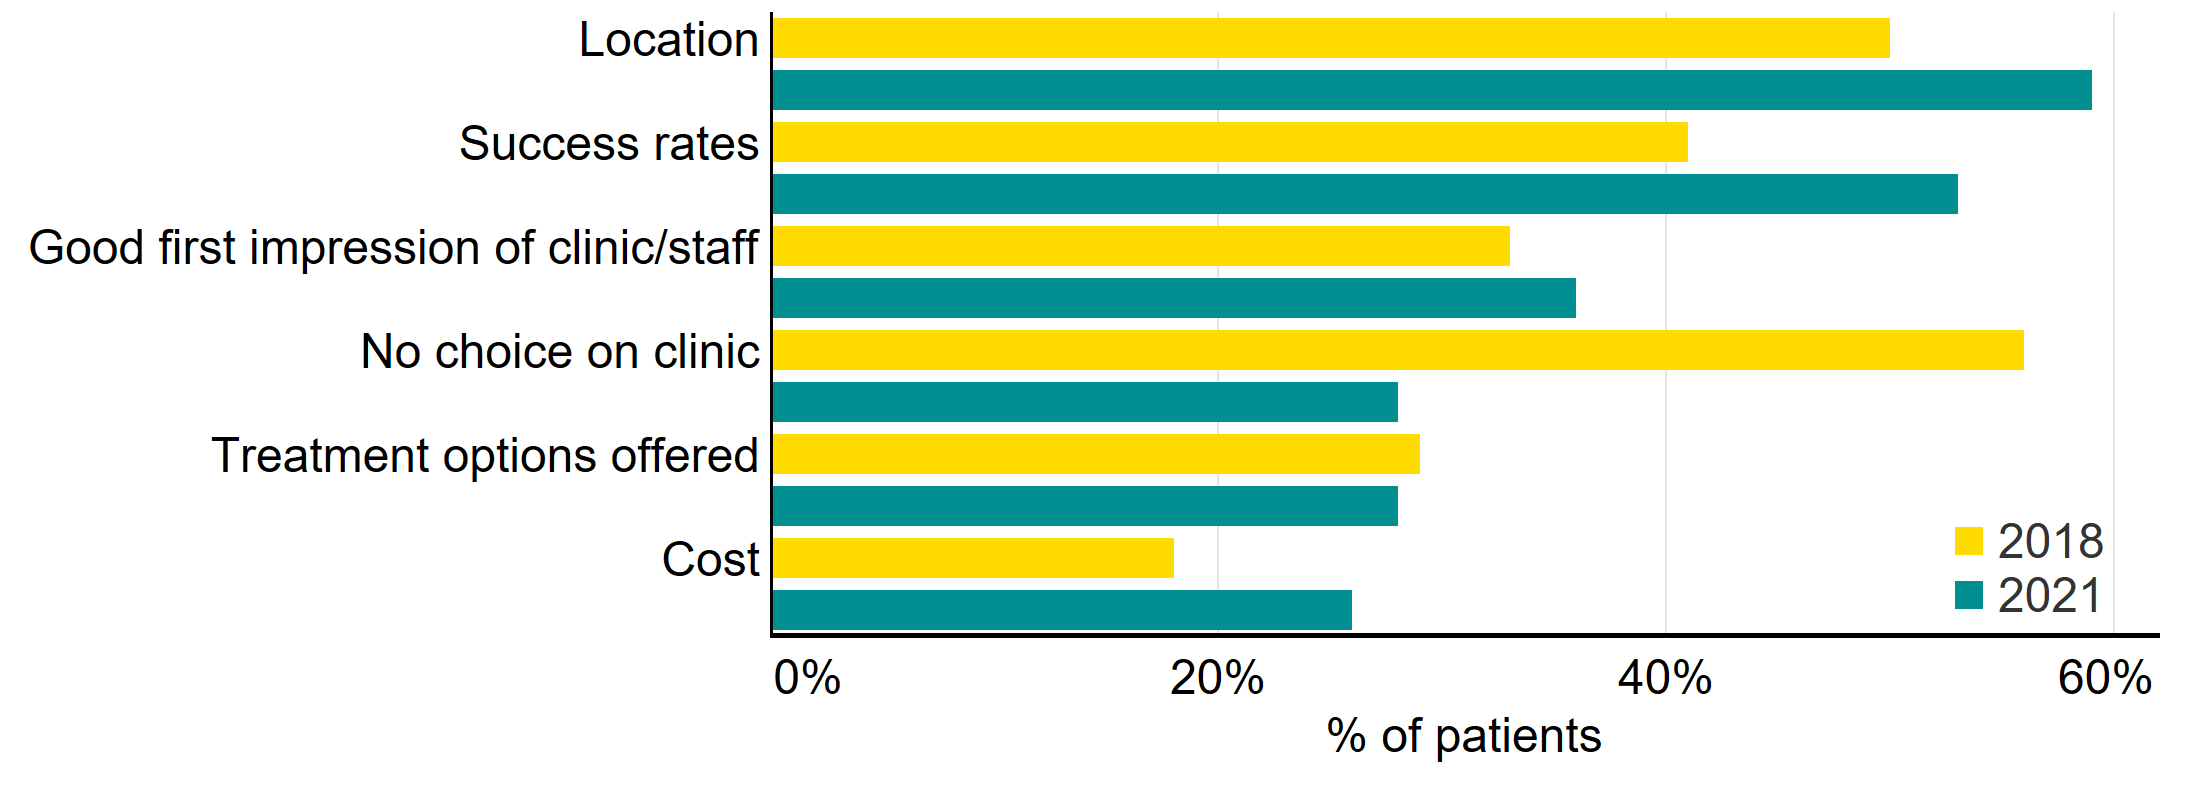
Q: ‘Which of the following factors, if any, were most important to you when choosing a fertility clinic? Please select up to 5 options which were most important to you’ (Multi code). Only the top sources are shown in the chart (N=1,233).
Download the underlying data for Figure 11 as Excel Worksheet.
Where success rates were important, private patients were most likely to access success rate information through clinic websites (72%), followed by the HFEA website (51%) and clinic information evenings/events (18%).
About our data
We received a total of 1,868 responses. Once partial completes and screened-out responses had been removed, a total of 1,233 patients were included in the analysis.
The survey was open to anyone who had undergone fertility treatment in the UK in the past ten years, including patients, partners, intended parents and surrogates. It was live between 2 November – 7 December 2021.
The survey is broadly representative of the fertility patient population, with a few exceptions. More details can be found in the Quality and Methodology Report. Due to small numbers, we have had to consider responses from patients of Black, Asian, Mixed and Other ethnicity patients together to draw comparisons by ethnicity.
Throughout the report, where subgroup differences are provided, many are unlikely to be statistically significant due to small numbers. Where this is the case, we have highlighted these with an asterisk. In addition, where NHS-funded and privately funded patients are referenced, this is generally anyone who has ever had NHS-funded only or privately funded only treatment, unless we are referring to recent treatment. In which case, results are filtered on most recent type of funding (i.e., NHS only or private only).
The report is based on responses from patients, partners, intended parents and surrogates. However, we use the term ‘Patients’ throughout as an umbrella term to include each of these groups.
Contact us regarding this publication
Media: press.office@hfea.gov.uk
Statistical: intelligenceteam@hfea.gov.uk
1 Throughout the report, the term ‘Patient’ has been used as an umbrella term to include Patients, Partners, Intended Parents and Surrogates. We have taken the decision to refer to all respondents as patients, since many partners, intended parents and surrogates also consider themselves to be patients, and will also have been involved in treatment themselves.
2 Due to small base sizes for many sub-groups, many of the differences highlighted in the report may not be statistically significant. Where this is the case, we have flagged this with an asterisk (*).
3 Please note that in 2018 it was phrased as ‘The chances of success’ instead of ‘Your chance of success’, which may have impacted the decline.
4 It should be noted that the survey was only open to those who had previously had treatment in the UK, which may have impacted results here.
5 It is worth bearing in mind, however, that in 2018 patients could select up to six options – this time it was five.
Review date: 15 April 2027