
Fertility treatment 2022: preliminary trends and figures
Preliminary UK statistics for IVF and DI treatment, storage, and donation
Published: July 2024
Download the underlying dataset as .xlsx
Table of contents
- Main points
- Note on preliminary data
- Section 1: Average IVF pregnancy rate using fresh embryo transfers increased
- Section 2: Average IVF pregnancy and birth rates using frozen embryo transfers similar to previous years
- Section 3: Average age at first IVF treatment increased above 35 years of age for first time
- Section 4: New egg and sperm donors increased by 21% from 2019 to 2022
- Section 5: Egg storage fastest growing treatment, but accounted for 5% of all cycles in 2022
- Section 6: Multiple births from IVF at lowest UK average yet of 4%
- Section 7: Increased patients with female partners and single patients using IVF in 2022
- Section 8: NHS-funded IVF cycles decreased to a record UK low of 27%
- About our data
Main points
- Around 52,500 patients had in vitro fertilisation (IVF) and 3,000 had donor insemination (DI) treatment, at Human Fertilisation and Embryology Authority (HFEA) licensed fertility centres in the UK in 2022.
- In 2022, most fertility service activity increased on pre-pandemic levels from 2019.
- IVF cycles (fresh and frozen embryo transfers) increased to 77,000 cycles in 2022 from around 69,000 in 2019 (+11%). DI cycles returned to pre-pandemic numbers of around 6,000 cycles (-1%) in 2022.
- Average IVF pregnancy rates using fresh embryo transfers increased nationally to 31% per fresh embryo transferred in 2022, with the highest pregnancy rates among patients aged 18-34 at 42%.
- Preliminary average IVF birth rates using fresh embryo transfers for patients aged 18-34 were 35% per embryo transferred, and 5% for patients aged 43-44 when using their own eggs in 2022.
- In 2022, the average IVF pregnancy rate using frozen embryo transfers was 36% per embryo transferred and the average preliminary IVF birth rate was 30% per embryo transferred. The birth rate among younger patients is expected to increase following data validationI, as birth rates are typically three percentage points lower than pregnancy rates.
- In 2022, the UK average multiple birth rate reached the lowest level yet at 4%, falling from 28% in the 1990s.
- Egg storage cycles accounted for 5% of cycles across the UK in 2022, increasing from around 2,500 cycles in 2019 to around 4,600 in 2022 (+81%).
- The average age of first-time IVF patients increased to just over 35 years old and DI patients’ average age was 33.6 in 2022. In comparison, the overall average age that women in England and Wales had their first birth in 2022 was 29.2, according to the Office for National Statistics (ONS).
- New egg and sperm donors increased by 21% from 2019 to 2022, however UK-based sperm donors decreased by 11%.
- Single patients increasingly used both IVF and DI from 2019 to 2022, with the largest increases in IVF usage (+82%).
- The proportion of National Health Service (NHS) funded IVF cycles decreased across the UK to the lowest since 2008, with only 27% of IVF cycles NHS-funded in 2022, compared to 40% in 2012.
- The number of NHS-funded IVF cycles carried out continued to vary across the UK with decreases of 17% in England, 16% in Wales, and 7% in Scotland from 2019 to 2022.
Note on preliminary data
This report provides an update on fertility treatment and outcomes in the UK from 1991 to 2022. Due to the COVID-19 pandemic and large-scale work to upgrade the HFEA data submission system and migrate data to a new database, data on treatments and pregnancies from 2020-2022 and outcomes from 2019-2022 have not yet been validatedI. This means that some data in this report is preliminary and cannot be compared to other reports. Data validation is expected to be complete by late 2024.
Some sections of this report describe short-term trends between 2019 and 2022 to provide an indication of how fertility treatments and those accessing treatments may have varied throughout and following the COVID-19 pandemic. See our Impact of COVID-19 on fertility treatment 2020 report, and our previous Fertility treatment 2021: preliminary trends and figures report for more information.
The new HFEA dashboard gives users the opportunity to explore HFEA data from 1991 onwards and find statistics on their own areas of interest. The dashboard is interactive, allowing users to investigate the topics in this report in more detail.
1. National average IVF pregnancy rate using fresh embryo transfers increased
In 2022, 52,500 patients had almost 77,000 fresh and frozen embryo transfer IVF cycles at licensed fertility clinics in the UK. Over 90% of these patients underwent treatment with a partner, bringing the total number of people involved in IVF cycles to around 100,000 people in the UK.
The average overall pregnancy rate from IVF using fresh embryo transfers and patient’s own eggs increased from 21% per embryo transferred in 2012 to 31% in 2022. Patients aged 18-34 had the highest pregnancy rate per embryo transferred at 42% in 2022 (Figure 1). Pregnancy rates per embryo transferred increased from 22% in 2012 to 34% for patients aged 35-37, and from 17% to 26% for patients aged 38-39 in 2022. For patients aged 40-42 pregnancy rate per embryo transferred increased from 10% in 2012 to 16% in 2022.
For patients aged 43-44 pregnancy rate per embryo transferred increased when using their own eggs from 5% in 2012 to 9% in 2022. Due to the impact of patient age on pregnancy and birth rates, some older patients may choose to use donor eggs to increase their chances of successful treatment. You can find out more in our Trends in egg, sperm and embryo donation 2020 report.
Rising pregnancy rates for all age groups relate to improved clinical and laboratory practice.
Patient age is one of the most important factors of whether a treatment may be successful, however the average age of fertility patients starting treatment has increased in the last decade. The declining success rates with age highlights the importance of not delaying contacting a GP or fertility clinic. (see Section 3 for further information about patient age). For more detailed information on pregnancy rates by patient demographics see the underlying dataset and the HFEA dashboard.
Figure 1. IVF pregnancy rate using fresh embryo transfers increased for all ages since 2012
Average fresh embryo transfer IVF pregnancy rate per embryo transferred using patient eggs by age group, 1991-2022 (preliminary 2020-2022 data)
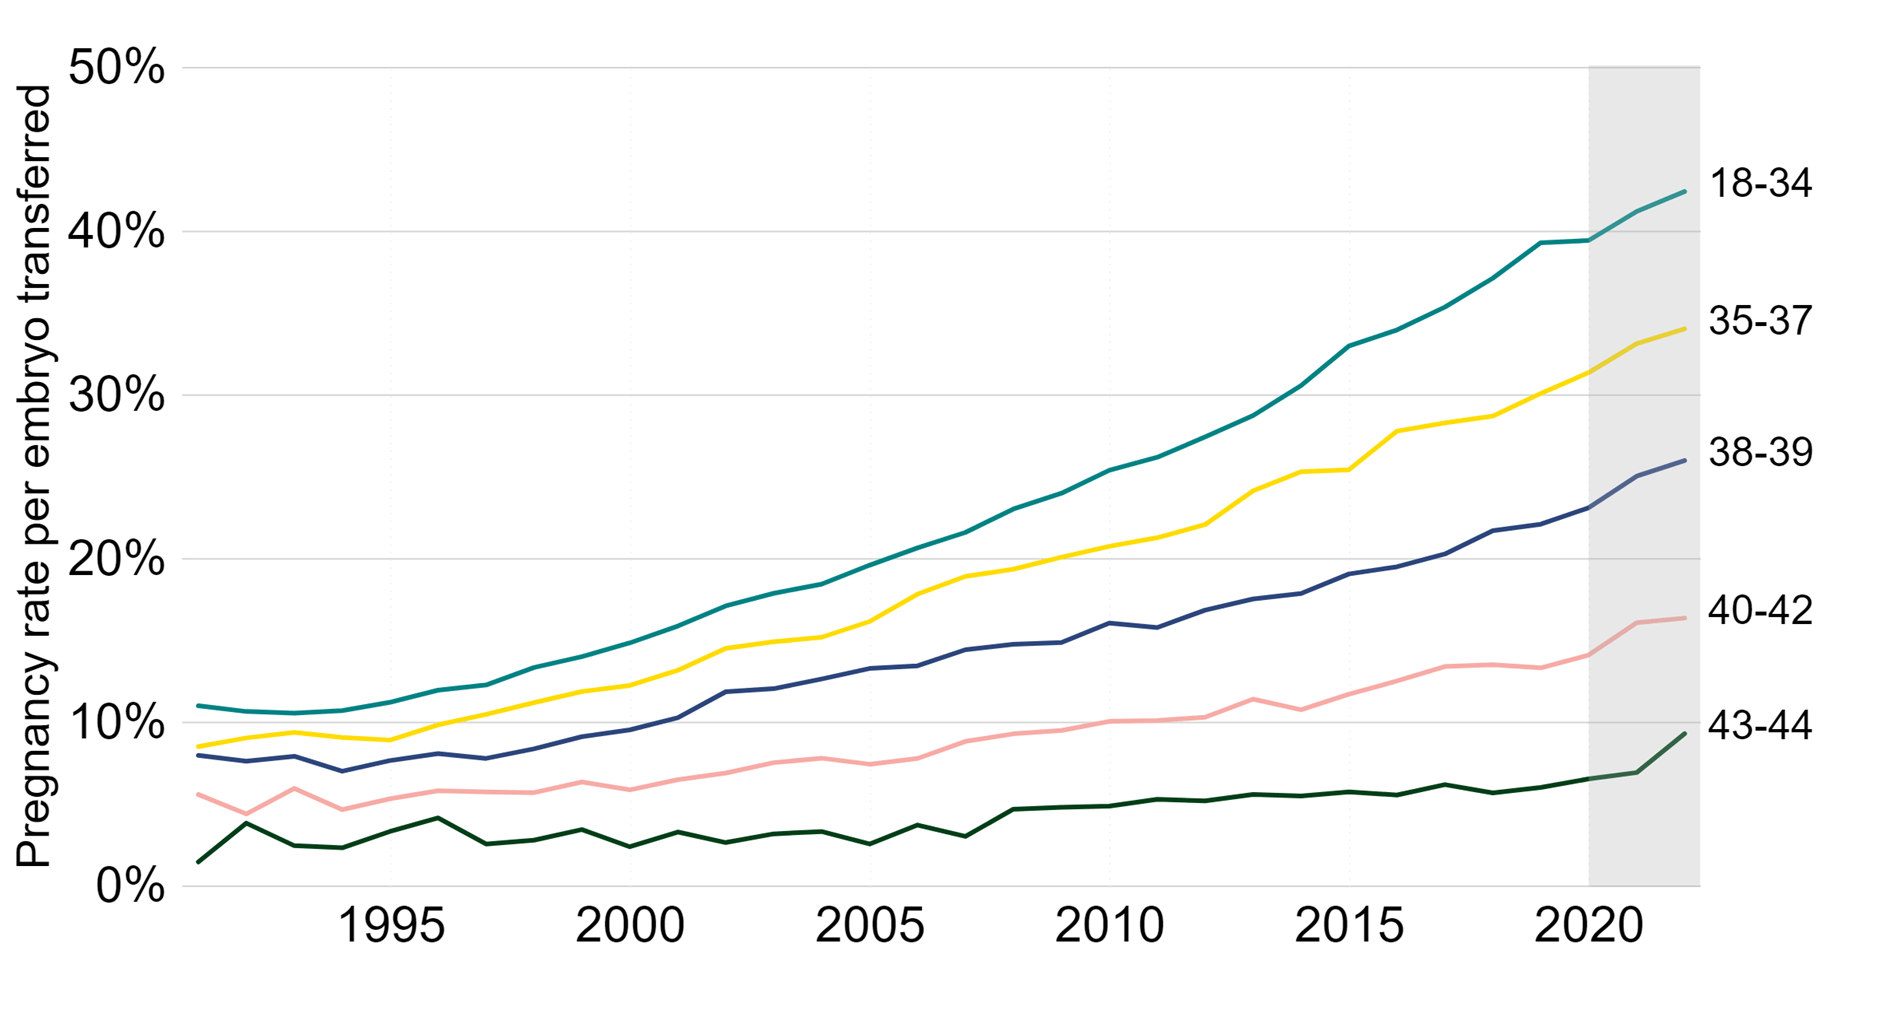
Note figure 1: Pregnancy rates per embryo transferred for 2020-2022 are preliminary and have not been validated (grey banding). This data includes IVF treatment cycles using their own eggs and fresh embryo transfers, and begun with the intention of immediate treatment, instead of storing eggs or embryos for future use. PGT-A/M/SR treatments and treatments using donor eggs or surrogacy have been excluded. Data from one clinic is excluded due to data reporting issues.
Download the underlying data for Figure 1 as Excel Worksheet
The average birth rate from IVF using fresh embryo transfers and patient’s own eggs increased from 18% per embryo transferred in 2012 to a preliminary 24% in 2022 (Figure 2). The preliminary data currently show that the birth rates remained similar or slightly decreased from 2019 to 2022. It is expected that the birth rates will increase following data validationI, as birth rates are typically around 3% percentage points lower than pregnancy rates. In the meantime, we suggest using pregnancy rates as an indicator for progress in recent years.
Patients aged 18-34 had the highest preliminary average fresh embryo transfer IVF birth rate - per embryo transferred - at 35% in 2022. Live birth rates per embryo transferred increased from 19% in 2012 to 26% in 2022 for patients aged 35-37 and increased from 14% to 18% in 2022 for patients aged 38-39. For patients aged 40-42 birth rate per embryo transferred increased from 8% in 2012 to 10% in 2022. Birth rate per embryo transferred increased for patients aged 43-44, reaching an average of 5% in 2022.
Although live birth rates have increased steadily over the past three decades, not all patients have the same likelihood of a live birth. For example, our report on Ethnic diversity in fertility treatment 2021 found that Black patients had a nearly 10% lower average birth rate than other patients.
Figure 2. IVF birth rate using fresh embryo transfers remained similar in recent years
Average fresh embryo transfer IVF birth rate per embryo transferred using patient eggs by age group, 1991-2022 (preliminary 2019-2022 data)
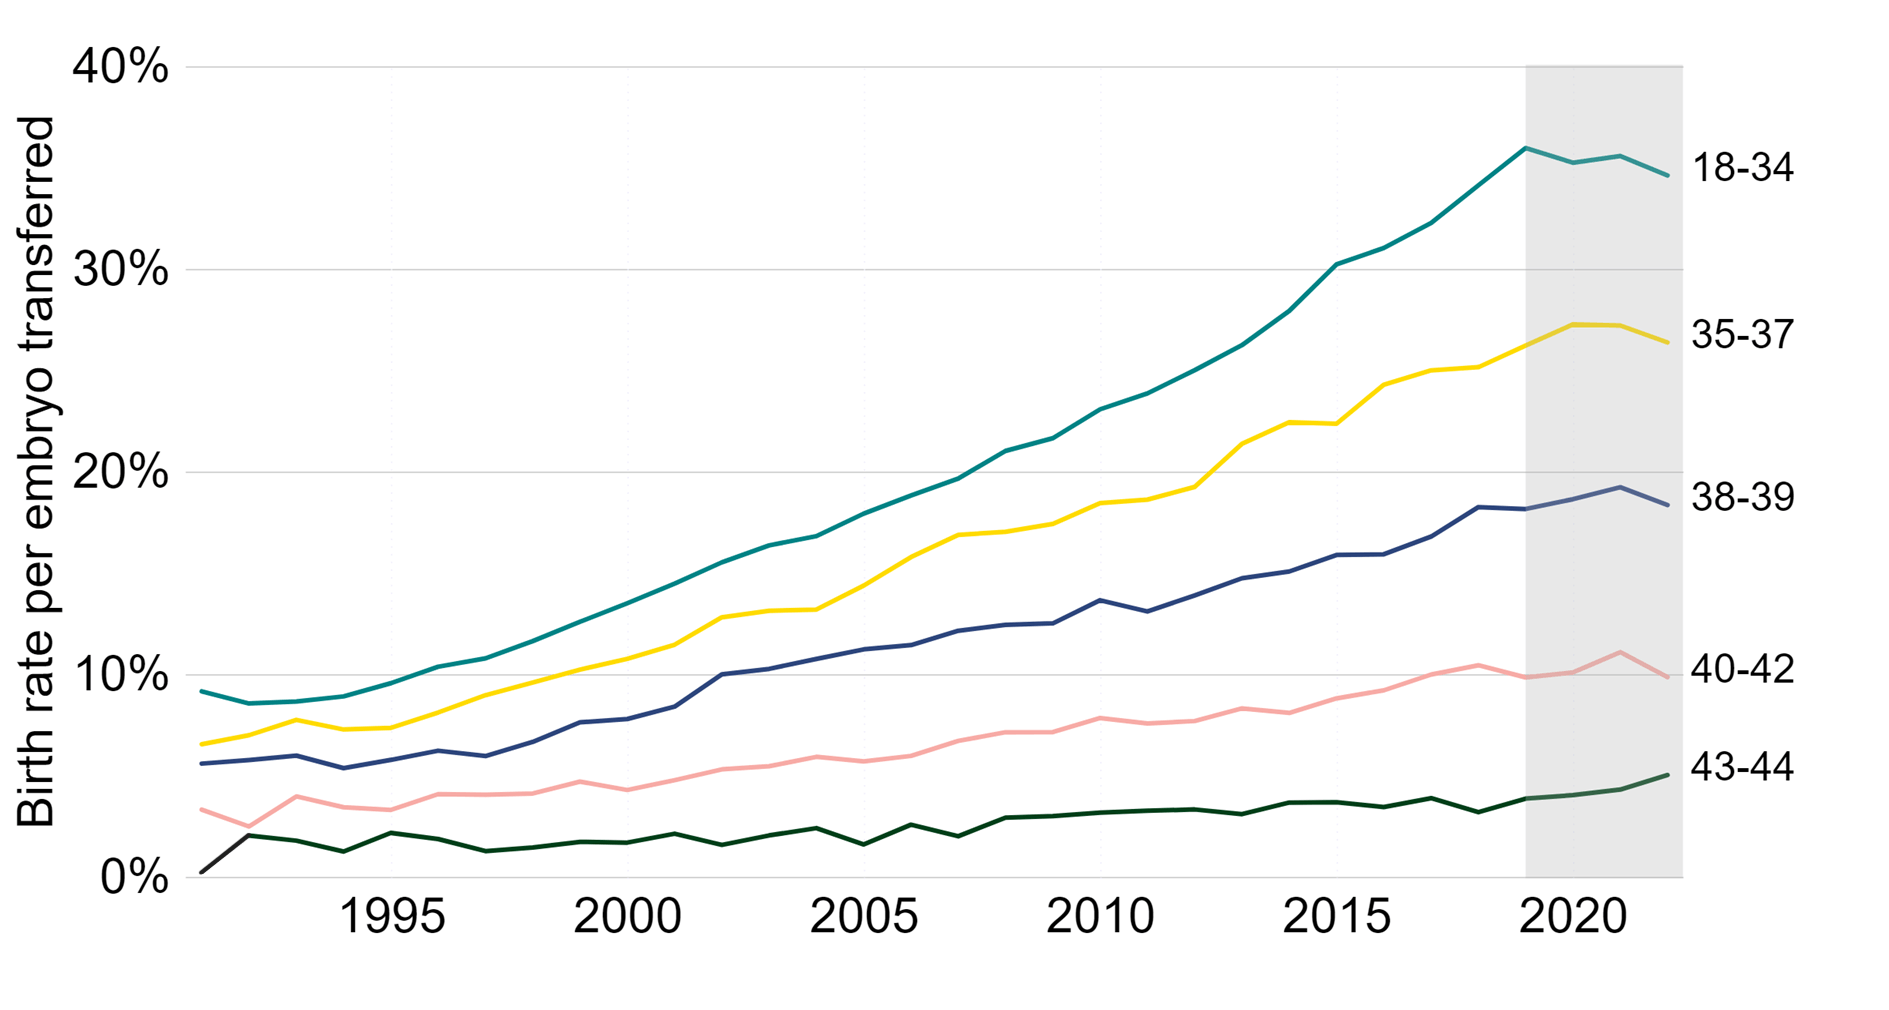
Note figure 2: Birth rates per embryo transferred for 2019-2022 are preliminary and have not been validated (grey banding). This data includes IVF treatment cycles using their own eggs and fresh embryo transfers, and begun with the intention of immediate treatment, instead of storing eggs or embryos for future use. Treatments using PGT-A/M/SR, donor eggs or surrogacy, and treatments in which a pregnancy was recorded and no birth outcome recorded have been excluded. Data from one clinic is excluded due to data reporting issues. Decreases in IVF birth rates from 2020-2022 are likely due to missing outcome data and are expected to increase following data validationI.
Download the underlying data for Figure 2 as Excel Worksheet
2. Average IVF pregnancy and birth rates using frozen embryo transfers similar to previous years
Following the introduction of vitrification into clinical practice as the standard freezing technique in the late-2000s, embryo storage has improved. A typical patient today will have a single fresh embryo transferred in their first cycle, and any additional embryos of suitable quality can be stored for use in subsequent cycles. Frozen embryo transfer IVF cycles have more than doubled in use from 2012 to 2022, while fresh embryo transfers decreased by 8% (see the underlying dataset for more information).
The average IVF pregnancy rate using frozen embryo transfers increased from around 17% in 2012 to 36% in 2022 (Figure 3). Importantly, the average IVF birth rate using frozen embryo transfers increased, in line with pregnancy rates, from around 15% in the 2012 to 30% in 2022. The preliminary birth rate currently shows that it remained similar from 2018 to 2022. It is expected that the birth rate in recent years will increase following data validationI. When using frozen embryo transfer data, pregnancy and birth rates are largely dependent on the age of the patient at embryo freezing rather than age at embryo transfer.
Figure 3. IVF pregnancy and birth rates using frozen embryo transfers have remained similar
Average frozen embryo transfer IVF pregnancy and birth rates per embryo transferred using patient eggs, 1991-2022 (preliminary 2019-2022 data)
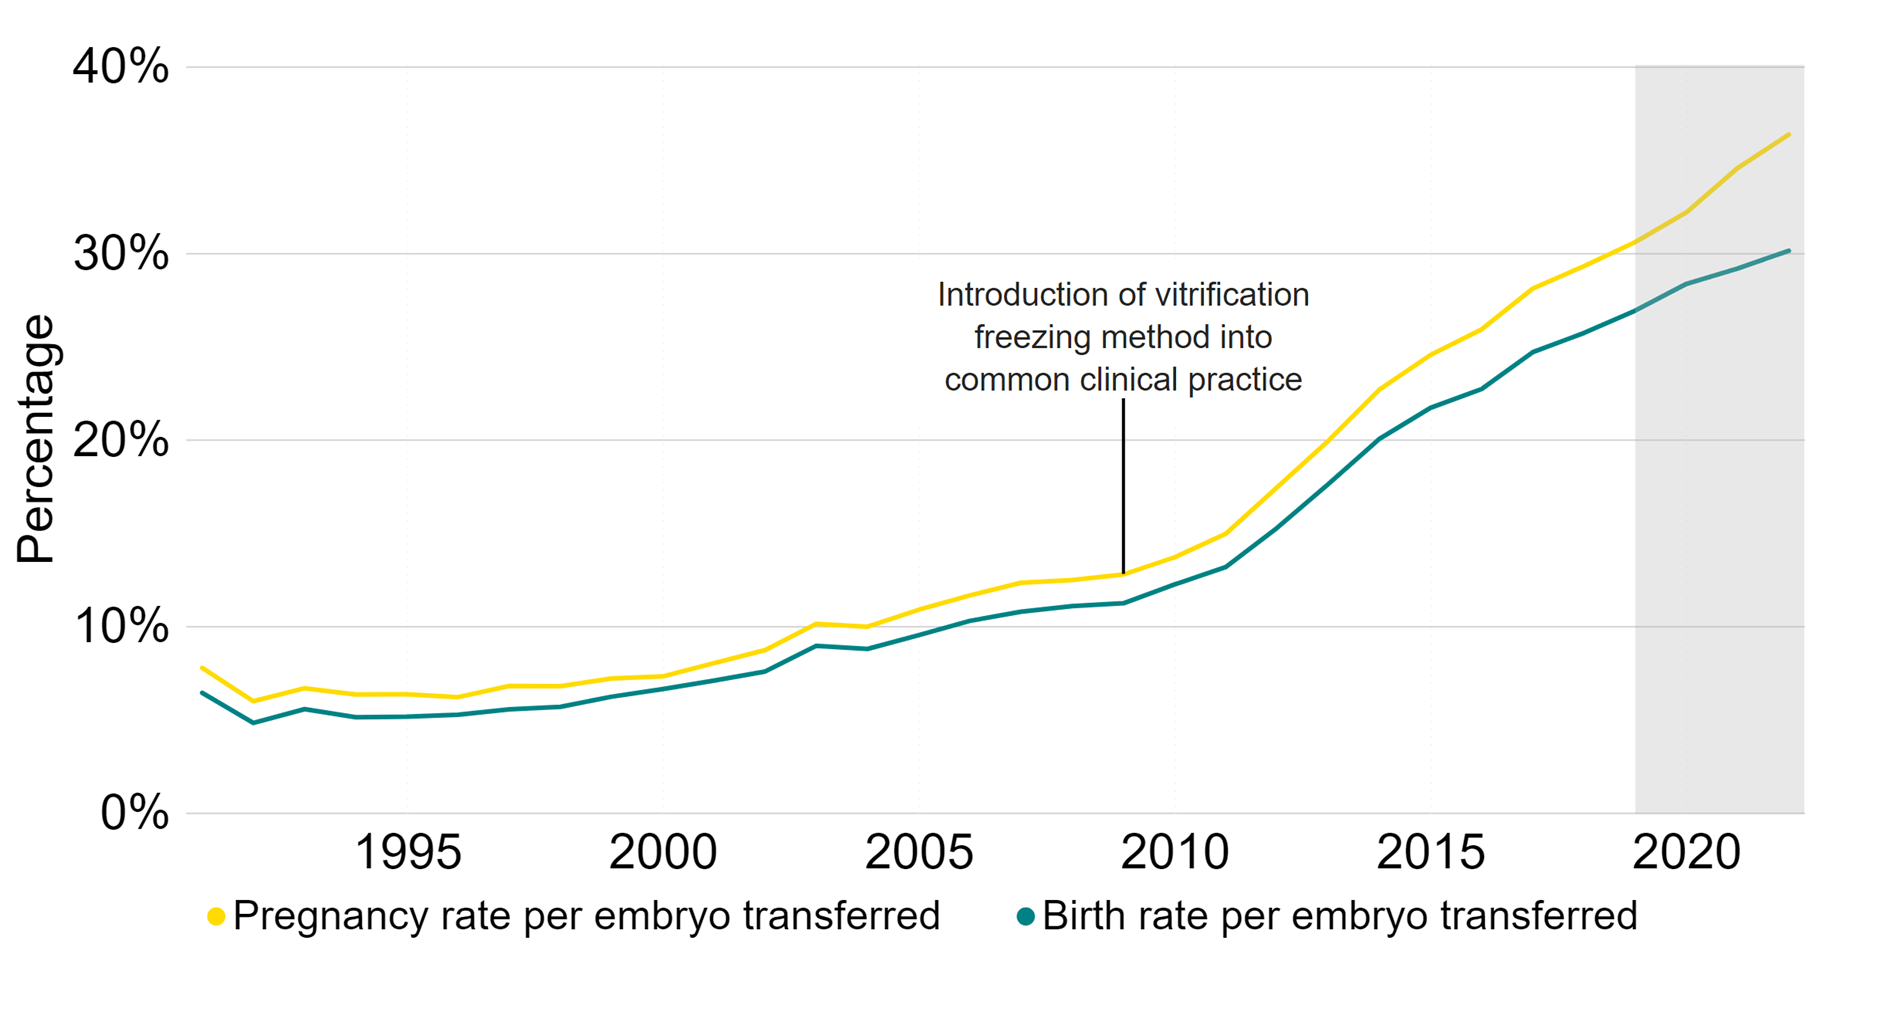
Note figure 3: Pregnancy rates per embryo transferred for 2020-2022 and birth rates per embryo transferred for 2019-2022 are preliminary and have not been validated (grey band). This data includes IVF treatment cycles using their own eggs and fresh embryo transfers, and begun with the intention of immediate treatment, instead of storing eggs or embryos for future use. Treatments using PGT-A/M/SR, donor eggs or surrogacy, and treatments in which a pregnancy was recorded and no birth outcome recorded have been excluded. Data from one clinic is excluded due to data reporting issues. Decreases in IVF birth and pregnancy rates from 2020-2022 are likely due to missing outcome data and are expected to increase following data validationI.
Download the underlying data for Figure 3 as Excel Worksheet
3. Average age at first IVF treatment increased above 35 years old for first time
In 2022, the average age of patients starting treatment was over 35 years old for IVF and 33.6 for DI (Figure 4). Since 2012, the average age of patients starting IVF has increased (+0.8 years), and in 2022 was the highest average age since data collection began in 1991. This compares to the average age that women in England and Wales have their first children, which increased from 28.2 in 2012 to 29.2 in 2022.1
The knock-on effect of delays across the NHS due to the COVID-19 pandemic, particularly in gynaecology, may have caused delays in some patients accessing fertility services.2 In addition, the increased average age may relate to increased difficulty in funding fertility treatment due to the recent increases in the cost of living and reductions seen in the proportion of NHS-funded IVF cycles across the UK.3 See Section 8, and our Impact of COVID-19 on fertility treatment 2020 report for more detail.
The average age of patients starting IVF varied by family type, with single IVF patients at an average just over 36 years old, compared with 35 among heterosexual relationships and 33.8 among female same-sex couples.
The introduction of ICSI (Intracytoplasmic sperm injection), a procedure where sperm is injected into an egg, which enables men with fertility problems to use their own sperm in treatment, was introduced into common clinical practice in the late 1990’s.4-5 This resulted in fewer patients with male partners using DI, causing the average age of DI patients to increase in during the 2000’s, as patient demographics shifted.
The average age of patients starting DI had decreased (-0.6 years) from 2012 to 2022. This was likely related to the changing family types accessing treatment following legislative changes in 2008 (see Section 7).6 In 2022, patients in female same-sex relationships and patients with a male partner both started DI treatment at 32.2, whereas single patients were on average older at 34.8.
Patient age when starting treatment has been shown to vary by patient ethnicity. Find out more in our National Patient Survey and Ethnic diversity in fertility treatment 2021 reports, where Black patients were typically older on average, and more likely to experience delays in speaking with a GP, than patients of other ethnicities.
Early contact with a GP and referral to fertility services if needed will help ensure the chances of achieving a live birth are as high as possible, as age is one of the most important factors in whether a treatment may be successful (see Section 1).
Figure 4. Average patient age at first IVF treatment increased to over 35
Average patient age at first treatment by treatment type, 1991-2022 (preliminary 2020-2022 data)
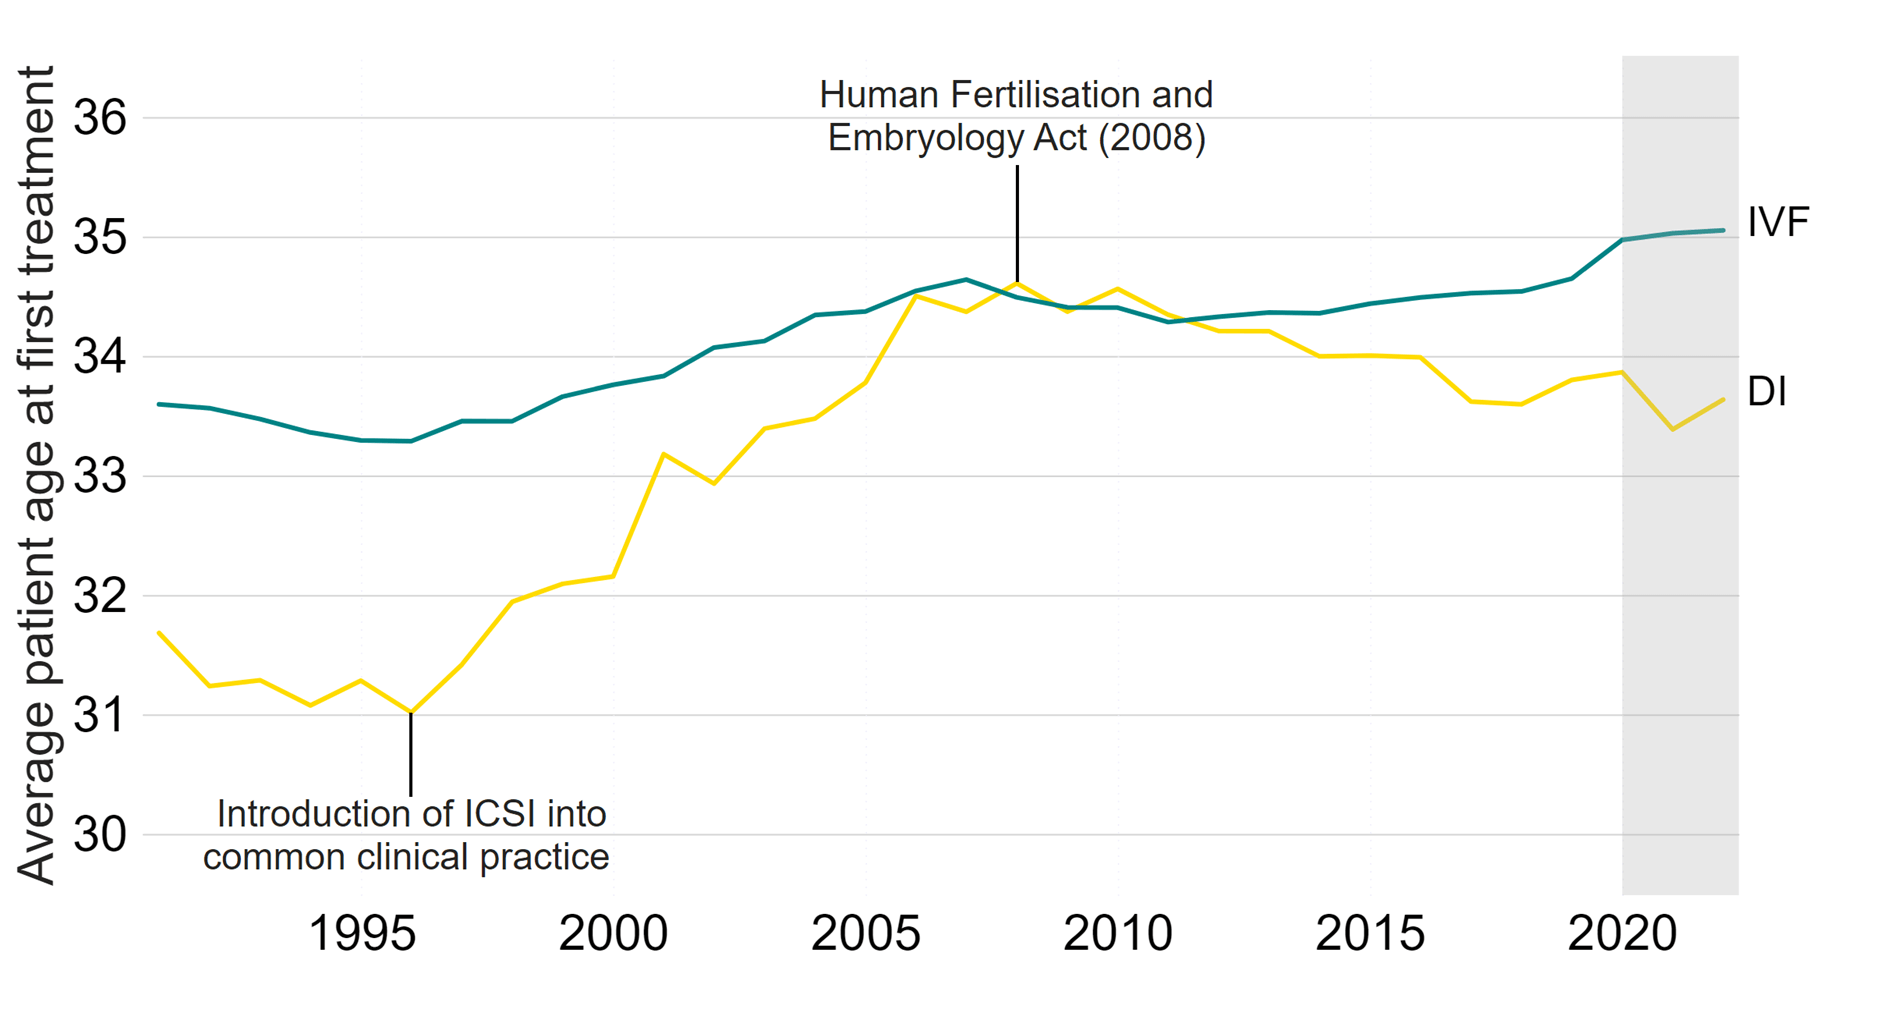
Note figure 4: Average age for patients when starting their first treatment is preliminary for 2020-2022 (grey band). This data includes the average (mean) age of patient at the time of their first cycle which was begun with the intention of immediate treatment, instead of storing eggs or embryos for future use. This means that patients who changed to IVF after one or more DI cycles would not be counted in the IVF average age, as their first treatment cycle was DI, and vice versa. Treatments using surrogacy have been excluded. Data from one clinic is excluded due to data reporting issues. Legislative changes in 2008 resulted in increased numbers of patients with female partners accessing treatment, particularly DI, and who were generally younger than patients with male partners.
Download the underlying data for Figure 4 as Excel Worksheet
4. New egg and sperm donors increased by 21% from 2019 to 2022
Use of donor eggs, sperm and embryos in fertility treatments has increased over the last decade, accounting for around 1 in 200 of all live births in the UK in recent years.7-9
The total number of new donors increased by 21% from 2019 to 2022 (Figure 5). New egg donors increased by 19% from 1,495 in 2019 to 1,782 in 2022, while sperm donors increased by 23% from 841 to 1,037. New egg and sperm donors decreased briefly during the pandemic, due to clinics prioritising patients who had experienced delays to treatment on resuming services rather than seeking new donors (see our Impact of COVID-19 on fertility treatment 2020 and Trends in egg, sperm and embryo donation 2020 reports).
Figure 5. Egg and sperm donors have increased
Number of new egg and sperm donors, 1991-2022 (preliminary 2020-2022 data)
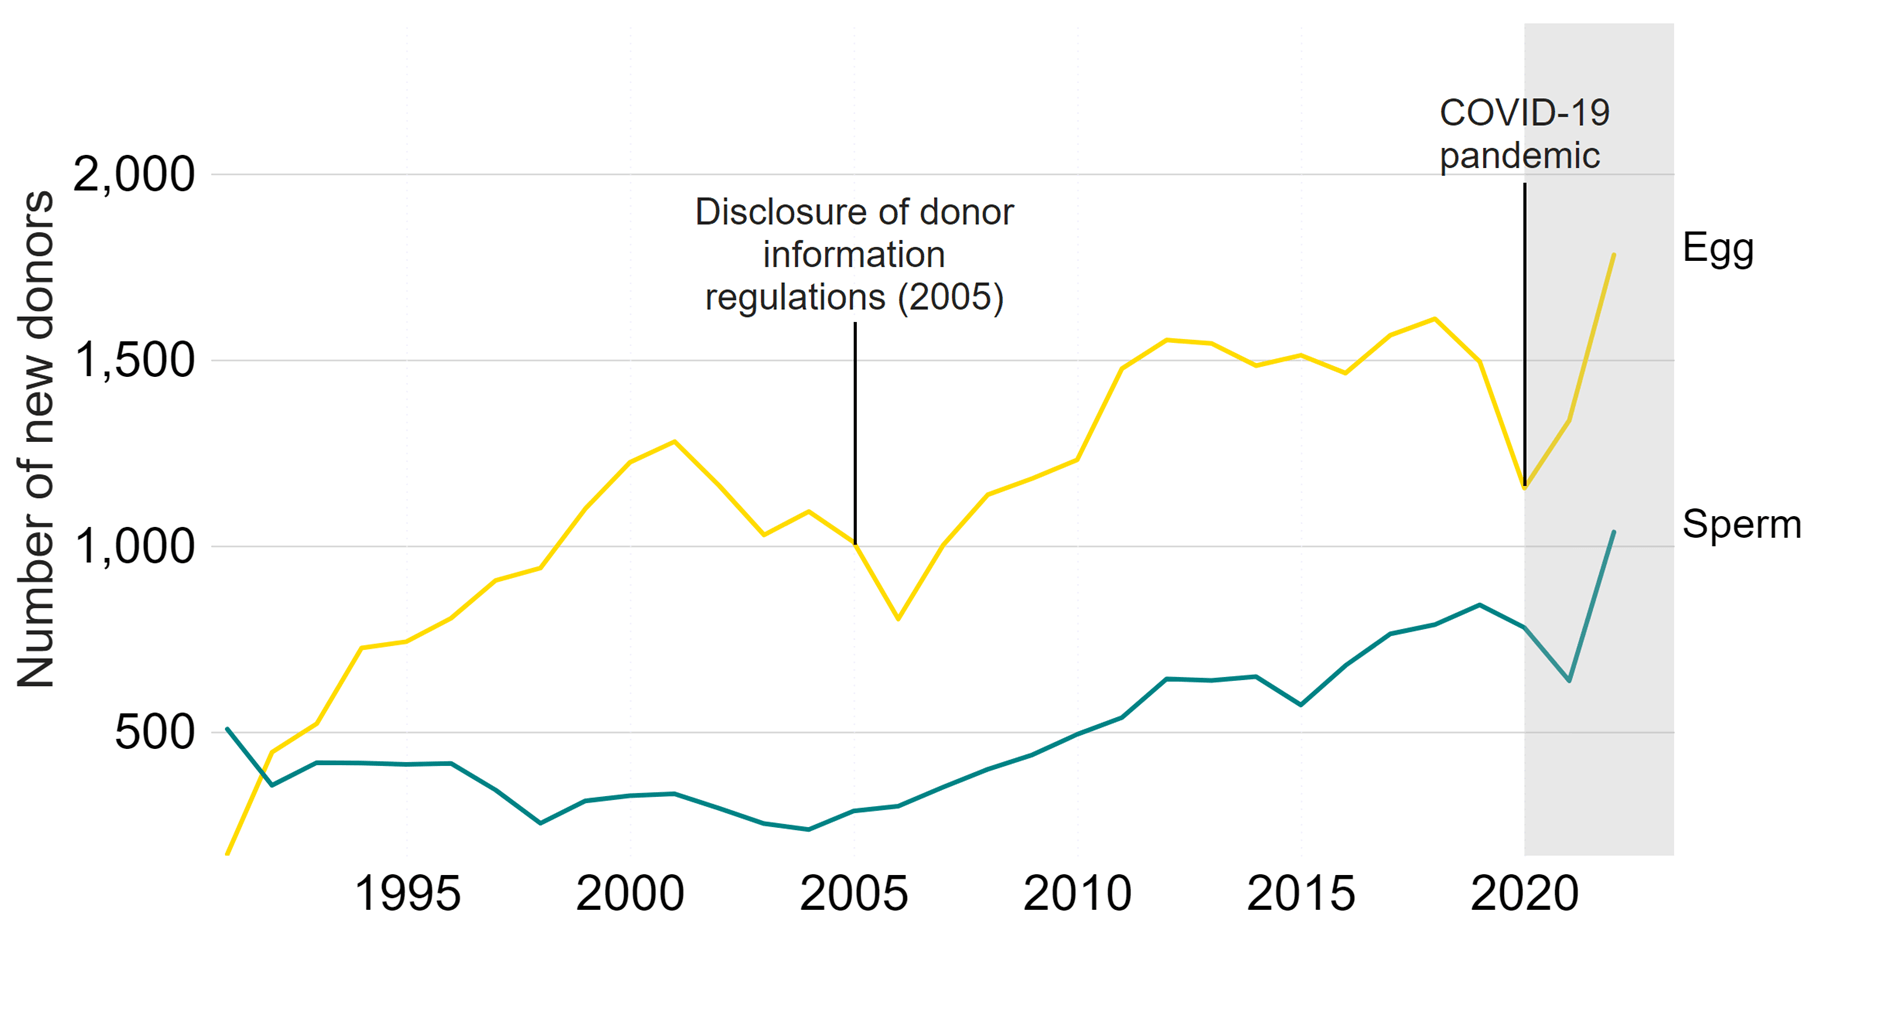
Note figure 5: New donor counts for 2020-2022 are preliminary and have not been validated (grey band). Donors that registered multiple times will only be counted in the year of their first registration. Decrease in donors during 2020/21 primarily due to the COVID-19 pandemic. Data from one clinic is excluded due to data reporting issues.
Download the underlying data for Figure 5 as Excel Worksheet
Over half (59%) of new sperm donors in 2022 were from donor imports, whereas 96% of new egg donors were UK-based in 2022. The higher proportion of UK egg donors in the UK is likely due to the difficulties in transporting eggs.
New UK-based sperm donors have decreased by 11% from 451 donors in 2019, to 401 donors in 2022. This decrease may be due in part to associated costs of recruitment within the UK.
In contrast, new sperm donors imported from Denmark increased by 26%, and 54% from the United States of America (USA) over the same period. The increase in sperm donor imports may relate to difficulties in accessing donor sperm for some patients, particularly patients from ethnic minority backgrounds, as well as ease of access to international sperm donor banks who may offer a wider choice of donors (see our National Patient Survey and Ethnic diversity in fertility treatment 2021 reports for more).
When an egg and/or sperm donation is made in the UK, HFEA guidance requires that clinics should ensure they are only used to create up to a maximum of ten families. However, as regulations differ in other countries, donations could be used to create additional families outside of the UK before or after the importation. Additionally, while imported donors are required to meet the same identifiability requirements placed on UK donors, there may be practical difficulties around donor-conceived people wishing to contact their donor if their donor lives abroad (see our Trends in egg, sperm and embryo donation 2020 report).
5. Egg storage fastest growing treatment, but accounted for 5% of all cycles in 2022
In 2022, IVF treatments accounted for 80%, and DI treatments accounted for 6%, of cycles across the UK. Embryo storage accounted for 10%, while egg storage (also known as egg freezing) accounted for 5% of cycles in 2022 (see Figure 6).
Figure 6. Egg storage cycles represented 5% of cycles in 2022
Number of cycles by type, 2022 (preliminary 2022 data)
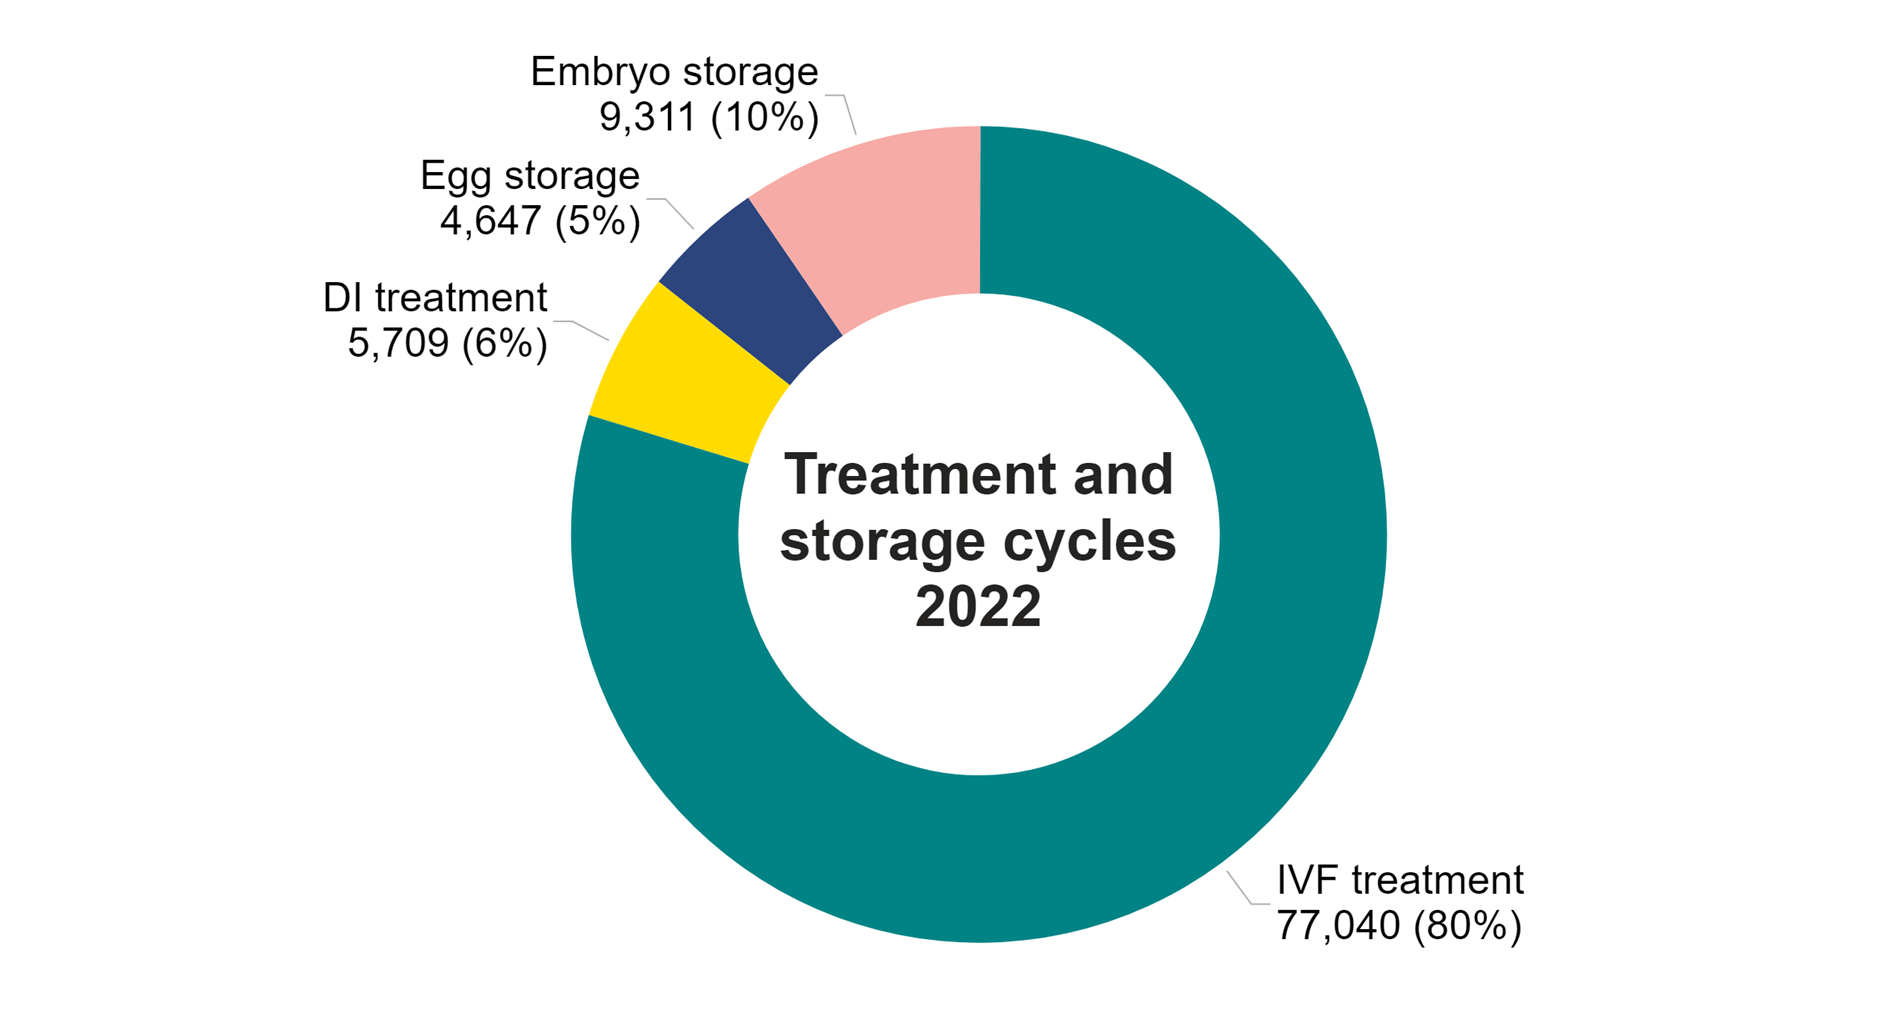
Note figure 6: This data included is preliminary for 2022. This data does not include cycles where eggs were collected for the purposes of donation. Data from one clinic is excluded due to data reporting issues. Due to rounding of numbers, percentage data may not add up to 100%.
Download the underlying data for Figure 6 as Excel Worksheet
Preliminary data from 2021 and 2022 suggests that all treatments had returned to pre-pandemic levels (Table 1), with IVF and DI treatment cycles increasing overall by 10% from 2019 to 2022. Fresh embryo transfer IVF increased by 7% and frozen embryo transfer IVF increased by 17% from 2019 to 2022. The larger increase in frozen embryo transfer IVF is consistent with longer term trends and will be due in part to increased use of single embryo transfers over the last decade.
DI cycles returned to pre-pandemic levels from 5,789 in 2019 to 5,709 in 2022 (-1%). In 2021, DI cycles had increased to 6,947, which may have been due in part to patients postponing treatment during the pandemic.
Egg and embryo storage cycles are the fastest growing fertility treatments in the UK. Egg storage cycles increased from 2,571 in 2019 to 4,647 in 2022 (+81%), while embryo storage cycles increased from 8,251 in 2019 to 9,311 in 2022 (+13%). Despite these large increases, embryo storage cycles accounted for 10% of all cycles carried out in 2022, and egg storage cycles accounted for 5% (Figure 6).
Egg storage data collected by the HFEA includes both elective fertility preservation as well as egg storage for medical reasons. The increase in egg storage cycles in recent years may be in part due to improved freezing techniques. Improved survival rates allow those storing for medical reasons to have confidence in freezing eggs, allowing patients to now choose between egg and embryo storage.
Non-elective fertility preservation was the only treatment permitted when clinics were suspended due to the COVID-19 pandemic, which will have led to storage cycles continuing to increase through 2020.10 Patients may also have chosen to freeze all their embryos rather than have immediate treatment during the pandemic. See our Impact of COVID-19 on fertility treatment 2020 and State of the fertility sector 2022/23 reports for more information on the pandemic.
| Table 1. Most treatment types have increased across the UK since 2019 | |||||
|---|---|---|---|---|---|
| Number of cycles by intended activity, 2019-2022 (preliminary 2020-2022 data) | |||||
| 2019 | *2020 | *2021 | *2022 | % change 2019 to 2022* | |
| IVF – fresh embryo transfer | 40,962 | 30,226 | 41,941 | 43,685 | +7% |
| IVF – frozen embryo transfer | 28,456 | 25,405 | 33,562 | 33,355 | +17% |
| DI | 5,789 | 5,283 | 6,947 | 5,709 | -1% |
| Treatment total | 75,207 | 60,914 | 82,450 | 82,749 | +10% |
| Egg storage | 2,571 | 2,448 | 4,233 | 4,647 | +81% |
| Embryo storage | 8,251 | 8,856 | 10,835 | 9,311 | +13% |
| Storage total | 10,822 | 11,304 | 15,068 | 13,958 | +29% |
| Note table 1: Cycle counts for 2020-2022 are preliminary and have not been validated (*). This data does not include cycles carried out for the purposes of donation. Data from one clinic is excluded due to data reporting issues. | |||||
Download the underlying data for Table 1 as Excel Worksheet
6. Multiple births from IVF at lowest UK average yet of 4%
Multiple births cause increased risk of health problems for patients and their babies, such as late miscarriage, premature delivery, gestational diabetes, still birth and neonatal and maternal death. There is also a significant cost saving to the NHS with the reduction in multiple births. A report in 2018 showed that twin births are, on average, almost three times as expensive as singleton births, costing the NHS millions of pounds each year.11
In the early 1990s the average UK multiple birth rate from IVF was around 28%, compared to 1-2% in natural conception.12 Following the launch of the ‘One at a time’ campaign in 2007 and the introduction of a multiple birth rate target in the UK in 2009, a 10% target was reached in 2017.
In 2022, the preliminary average multiple birth rate decreased to the lowest UK average yet of 4% (Figure 7). Most clinics operate within the national average, with around 90% of clinics meeting the 10% target in 2022.
Multiple births in IVF treatment are largely determined by the number of embryos transferred to the womb. Single embryo transfers only accounted for around 10% of IVF cycles in the early 2000s. Following the launch of the ‘One at a time’ campaign, single embryo transfers have increased over time and accounted for 85% of IVF cycles in 2022. This has led to the increased number of frozen embryo transfers, as single embryo transfer with later frozen embryo transfer has become common practice (See Section 2).
Importantly, birth rates have continued to rise while the multiple birth rate has fallen. This may be due in part to increased use of single embryos at day five of development (blastocyst). Blastocyst embryos have been increasingly used in the UK and may have helped to maintain birth rates from single embryo transfer while decreasing multiple birth rates. See our Multiple births in fertility treatment 2019 report for more information.
Figure 7. Average IVF multiple birth rate reduced further to 4% in 2022
Average IVF multiple birth rate, 1991-2022 (preliminary 2019-2022 data)
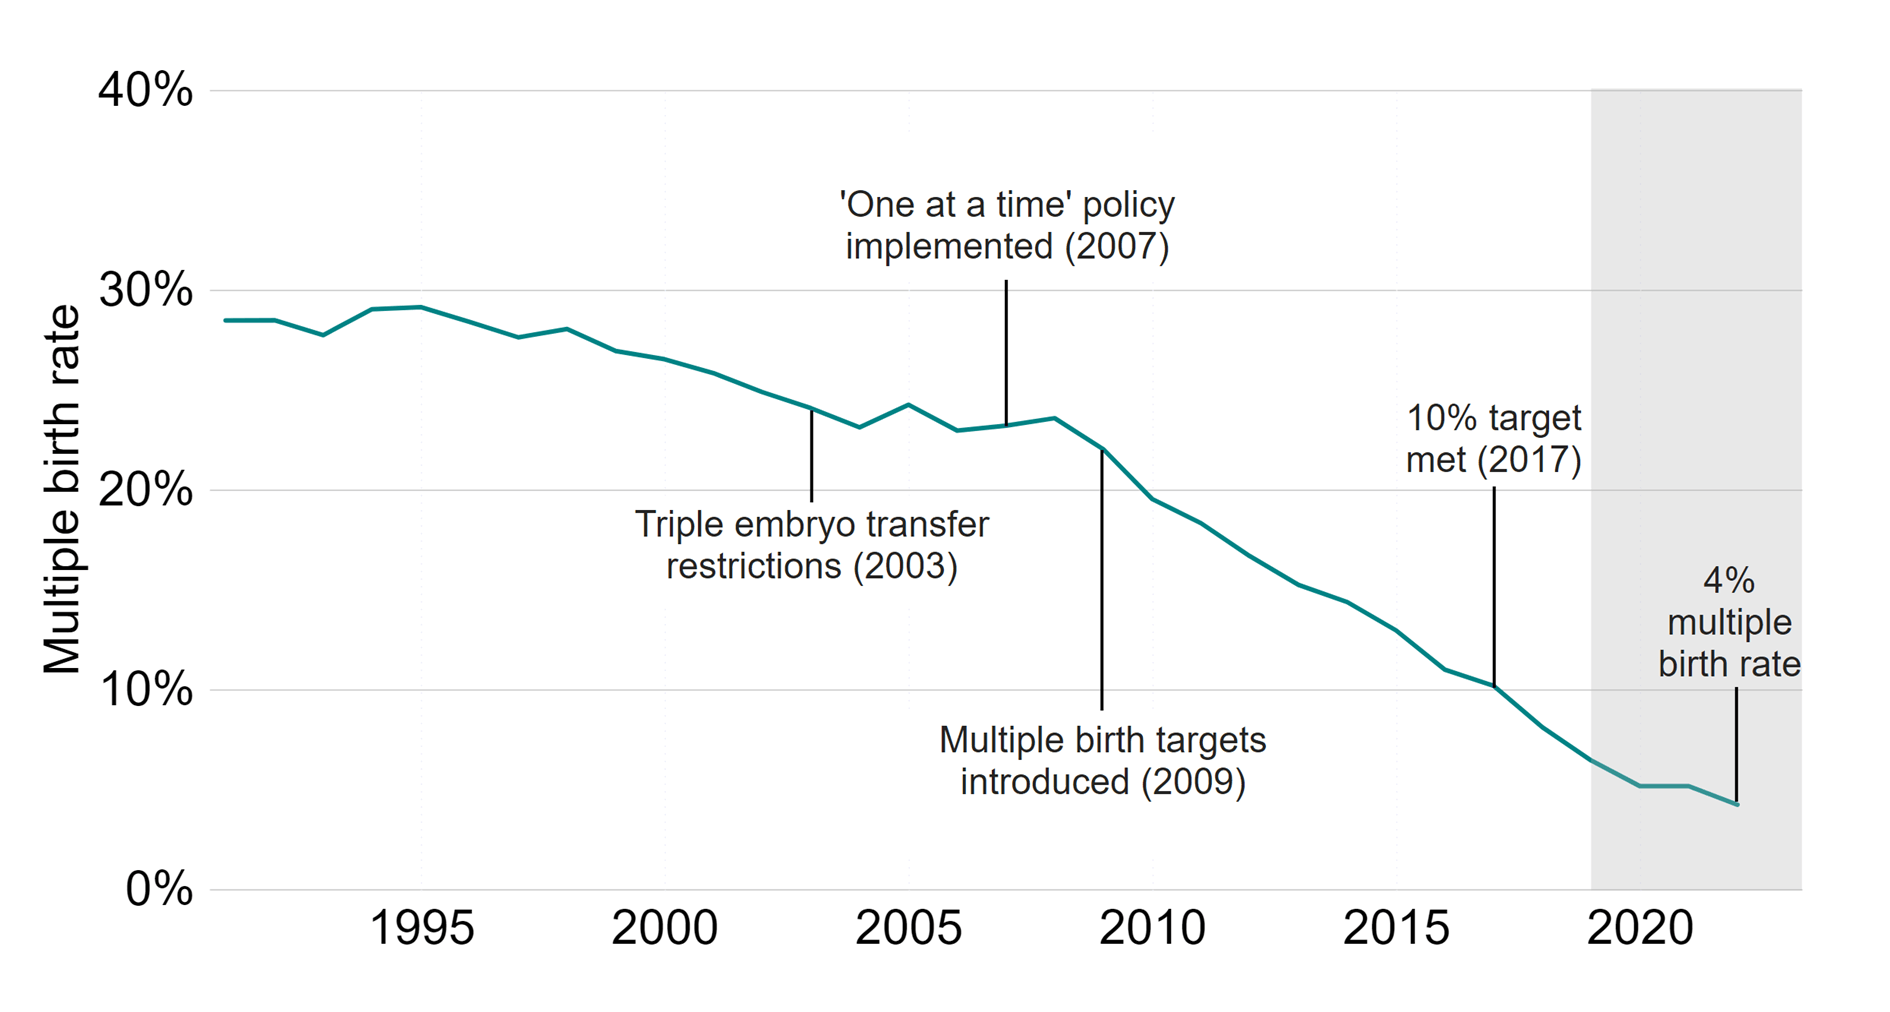
Note figure 7: Multiple birth rates per treatment cycle for 2019-2022 are preliminary and have not been validated (grey band). This data includes cycles using either patient or donor eggs and IVF treatment cycles begun with the intention of immediate treatment, instead of storing eggs or embryos for future use. Treatments in which a pregnancy was recorded and no birth outcome recorded have been excluded. Data from one clinic is excluded due to data reporting issues.
Download the underlying data for Figure 7 as Excel Worksheet
7. Increased patients with female partners and single patients using IVF in 2022
Patients in heterosexual relationships accounted for 90% of all IVF patients in 2022 and remained similar from 2019 to 2022 (+3%) (Table 2). The number of IVF patients in female same-sex relationships increased from 1,628 in 2019 to 2,200 in 2022 (+35%), and single patients increased from 1,953 in 2019 to 3,548 in 2022 (+82%).
The number of surrogates declined from 254 in 2019 to 230 in 2022 (-9%). More information on surrogacy can be found on our Surrogacy webpage.
In 2022, single patients accounted for the largest proportion of patients undergoing DI for the first time (50%), followed by patients in female same-sex (41%) and heterosexual relationships (12%). See our Trends in egg, sperm and embryo donation 2020 report for more information on donation.
The increased use of IVF for patients in female same-sex relationships and single patients may relate to the cost of funding multiple DI cycles prior to accessing NHS-funded IVF treatment in some regions or nations (see Family formations in fertility treatment 2018 report).
| Table 2. Increase in patients with female partners and single patients using IVF in 2022. | ||||||
|---|---|---|---|---|---|---|
| Number of patients by treatment type, family type and surrogacy, 2019-2022 (preliminary 2020-2022 data) | ||||||
| Treatment | 2019 | *2020 | *2021 | *2022 | % change 2019 to 2022* | |
| IVF | Male partner | 44,663 | 35,960 | 45,580 | 46,145 | +3% |
| Female partner | 1,628 | 1,619 | 2,237 | 2,200 | +35% | |
| No partner | 1,953 | 1,923 | 2,840 | 3,548 | +82% | |
| Surrogate | 254 | 216 | 240 | 230 | -9% | |
| DI | Male partner | 508 | 406 | 493 | 363 | -29% |
| Female partner | 1,335 | 1,271 | 1,564 | 1,242 | -7% | |
| No partner | 1,194 | 1,137 | 1,522 | 1,536 | +29% | |
| Note table 2: Number of patients is a distinct count. This means if a patient underwent two cycles in the same year they would be counted once. If they underwent a cycle in 2019 and then again in 2021, they would be counted once in each of these years. Data is preliminary for 2020-2022 (*). Includes patients undergoing treatment where the cycle was begun with the intention of immediate treatment, instead of storing eggs or embryos for future use. Data on intended parents is not available on the Register. This does not include patients who underwent IVF cycles where PGT-A or PGT-M has occurred or egg share cycles and may not directly compare to patient counts in other published sources. Data from one clinic is excluded due to data reporting issues. | ||||||
Download the underlying data for Table 2 as Excel Worksheet
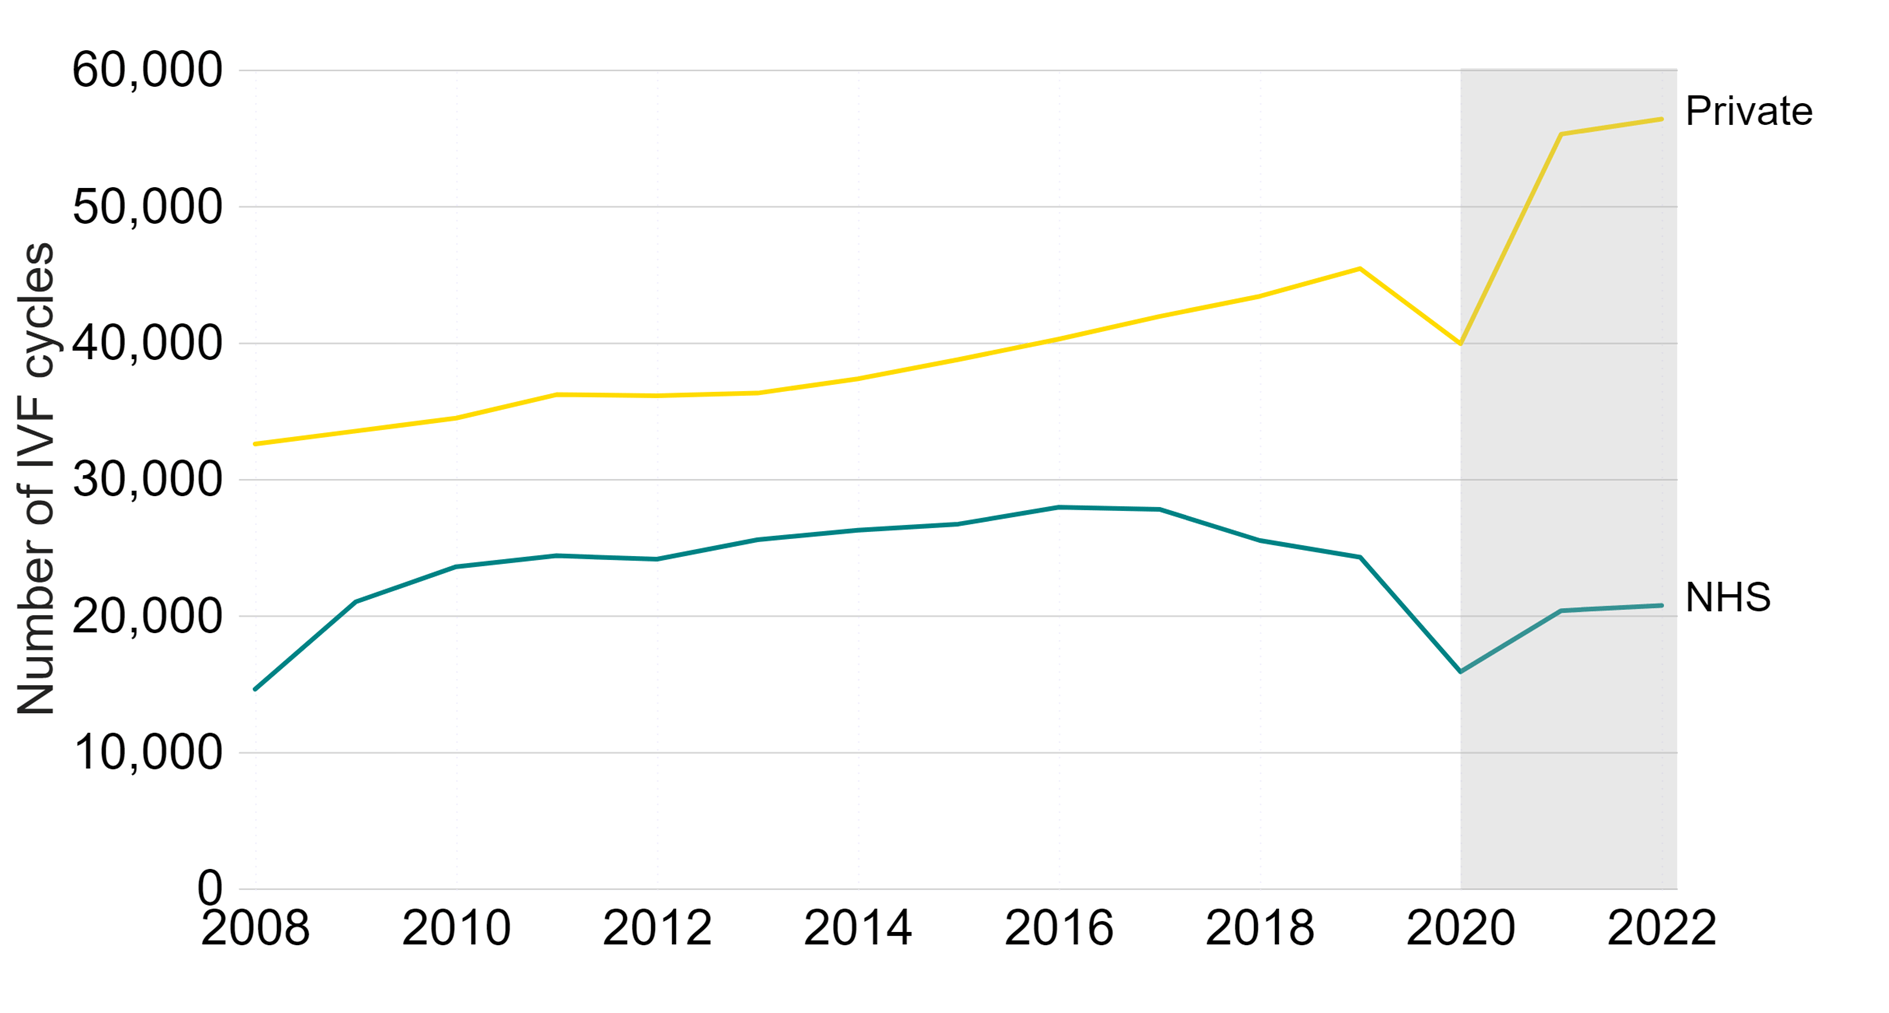
8. NHS-funded IVF cycles decreased to 27% in 2022
NHS funding for IVF cycles varies considerably across the UK depending on national funding criteria and local funding across Integrated Care Boards (ICBs) in England. In 2022, NHS-funded IVF cycles decreased to 27% across the UK, falling from 40% in 2012 (Figure 8).
The decrease in NHS-funded IVF treatments across the UK may relate to increased waiting times for further investigations prior to accessing NHS-funded treatments.2 See our Impact of COVID-19 on fertility treatment 2020 report for more information. Changes in national and regional funding criteria both in the devolved nations and across ICBs in England may have also had an impact on the number of NHS-funded IVF cycles, however changes in patient demographics such as increasing age may also mean that fewer patients meet the relevant criteria for NHS funding and therefore may need to self-fund their treatment (see Section 3 for more information).
Figure 8. NHS-funded IVF cycles decreased from 2019 to 2022 for most patient age groups
IVF cycles by funding, 2008-2022 (preliminary 2020-2022 data)
Note figure 8: Data is preliminary for 2020-2022 (grey band).This data includes IVF treatment cycles begun with the intention of immediate treatment, instead of storing eggs or embryos for future use. Data from one clinic is excluded due to data reporting issues.
Download the underlying data for Figure 8 as Excel Worksheet
In 2022, Scotland had the highest rate of NHS-funded IVF cycles at 53% compared to 34% in Wales and 24% in England. We are unable to report values for Northern Ireland for comparison due to technical issues in reporting from the largest clinic in Northern Ireland (Figure 9).
Although the number of NHS-funded IVF cycles in Scotland had remained similar in recent years, this slightly decreased from 2,936 cycles in 2019 to 2,723 in 2022. NHS-funded IVF cycles in England decreased from 19,631 in 2019 to 16,242 in 2022 (-17%). In Wales, NHS-funded IVF cycles decreased from 1,094 to 919 (-16%).
In Scotland, Wales and Northern Ireland, the level of NHS funding is set nationally, whereas funding in England is determined locally by ICBs.13 NHS-funded IVF varied considerably across English regions with rates declining in most regions from 2019 to 2022. The East Midlands had the largest decrease in NHS funded cycles from 1,451 to 753 (-48%). Yorkshire and the Humber had the largest increase between 2019 and 2022 from 1,009 to 1,183 (+17%).
Figure 9. NHS-funded IVF cycles decreased across all nations and most English regions since 2019
Proportion of IVF cycles funded by the NHS in UK nations and English regions, 2019-2022 (preliminary 2020-2022 data)
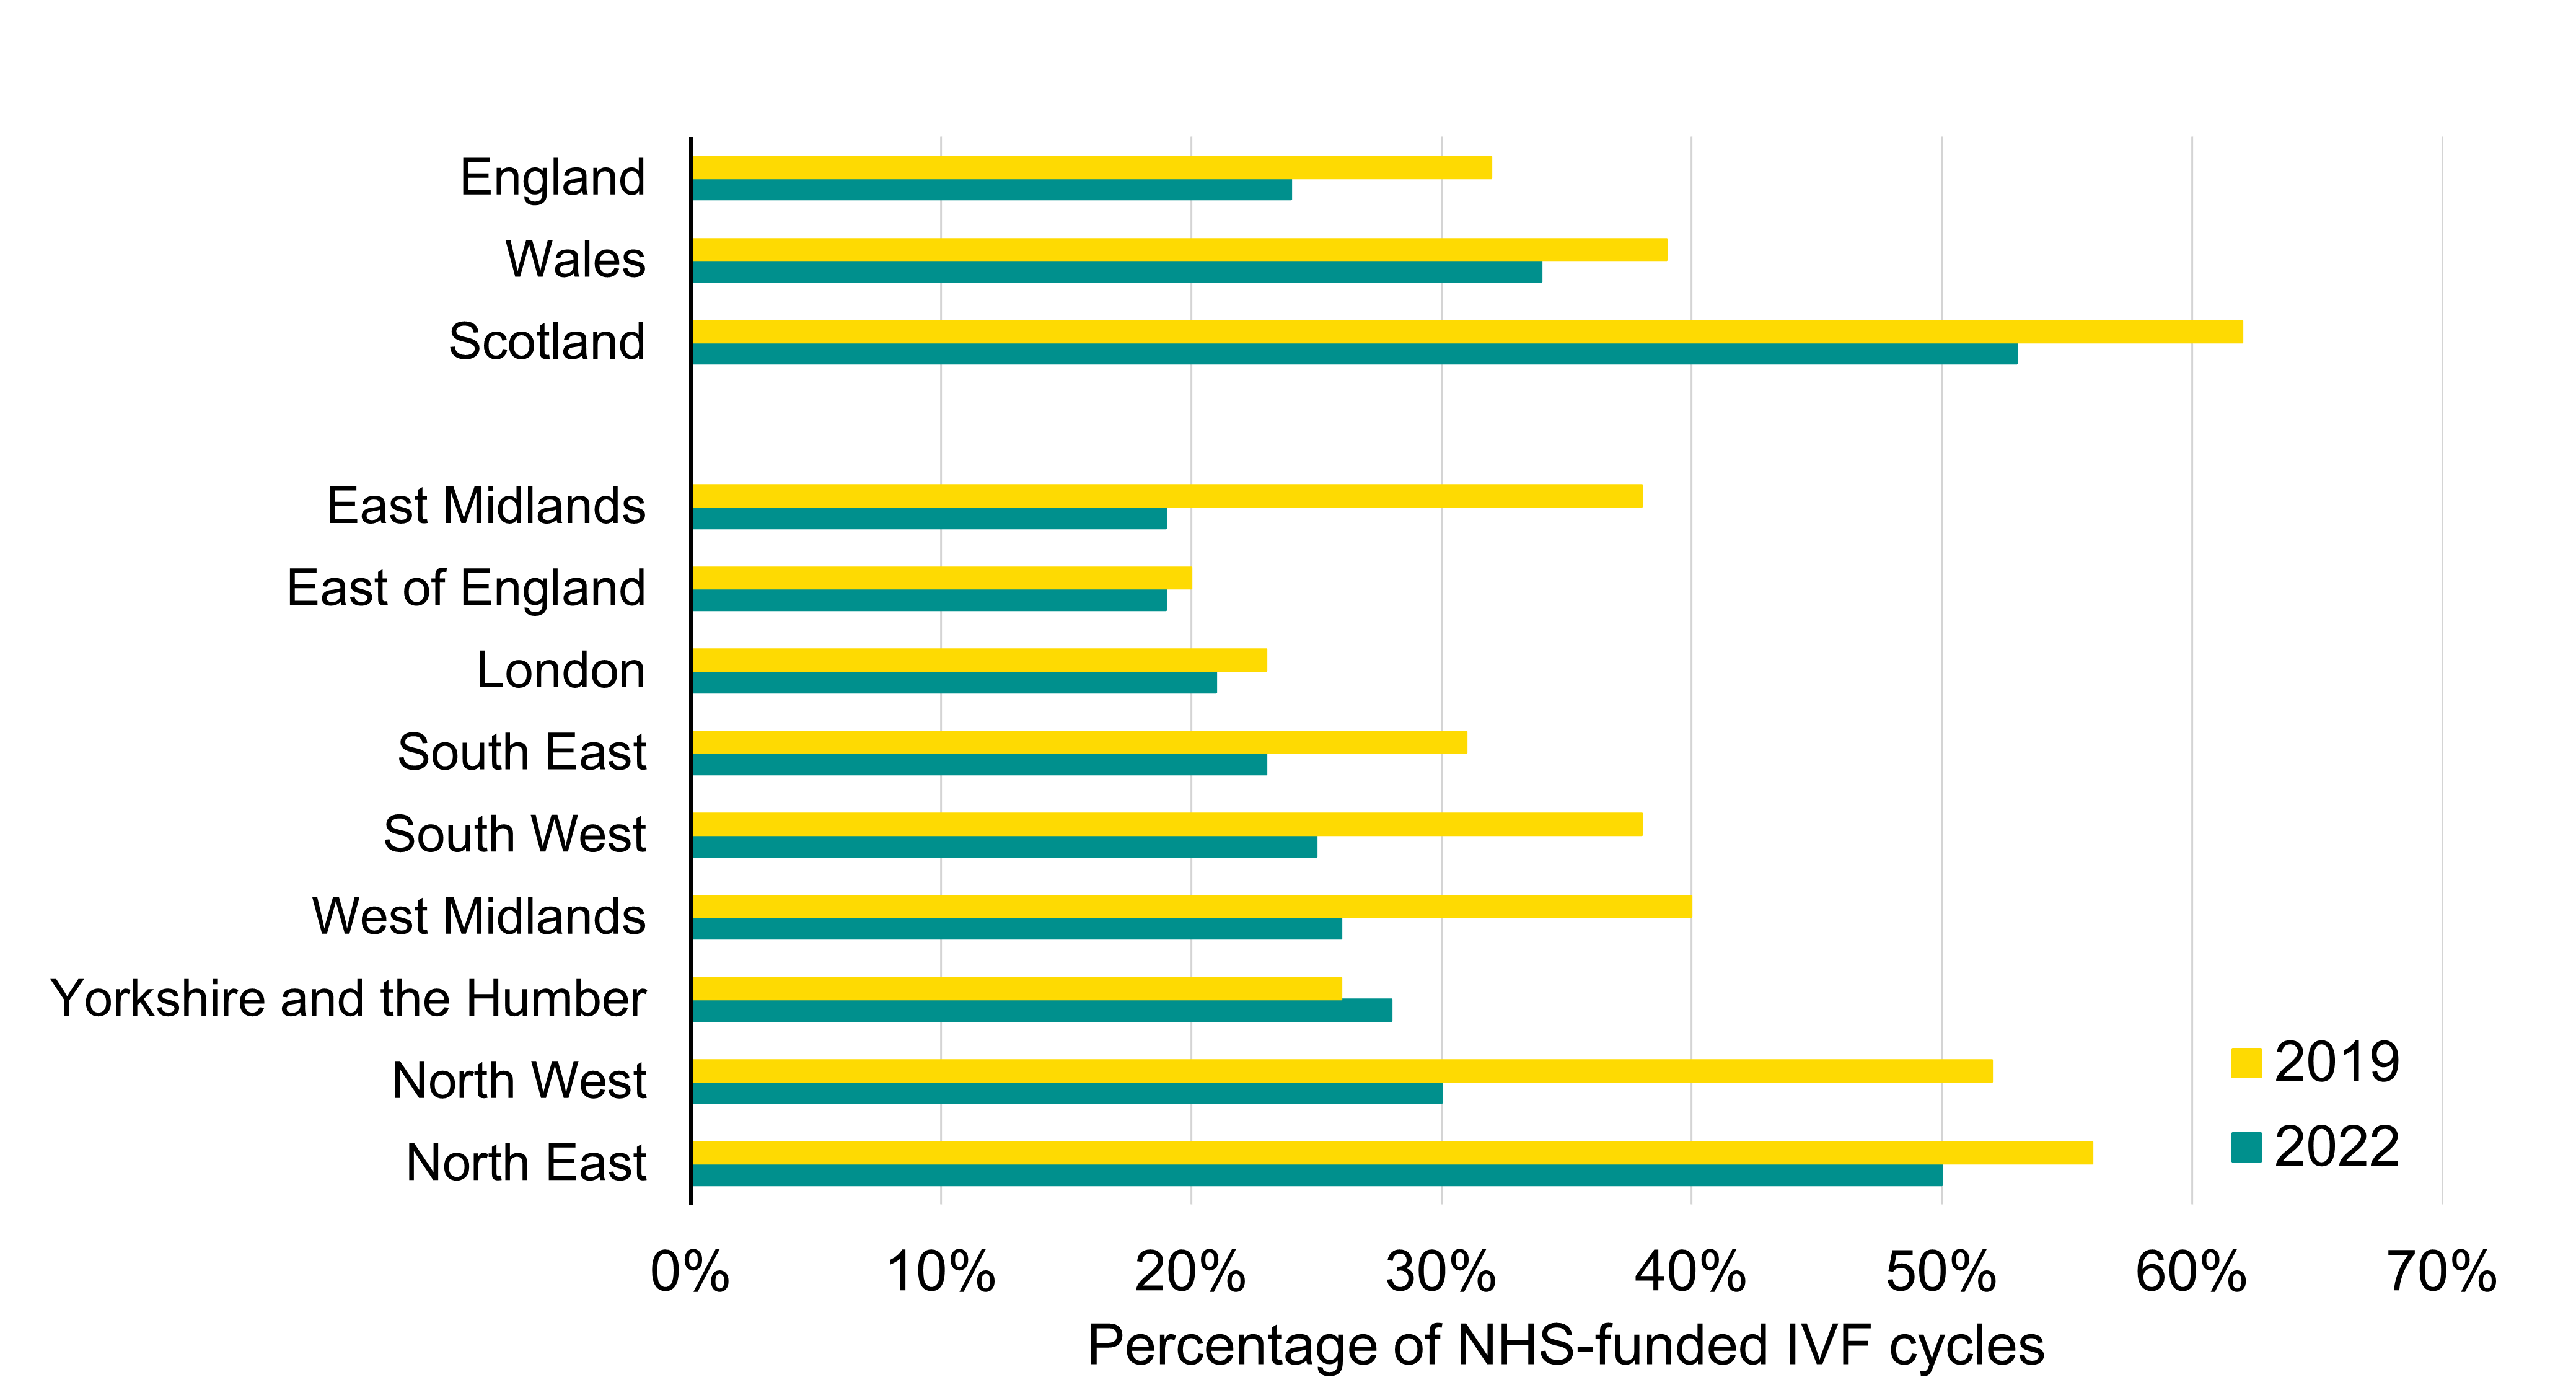
Note figure 9: Data for 2022 is preliminary. This data includes IVF treatment cycles begun with the intention of immediate treatment, instead of storing eggs or embryos for future use. Data for Northern Ireland has been excluded due to data reporting issues at one clinic in Northern Ireland. Data from one other clinic is excluded due to data reporting issues.
Download the underlying data for Figure 9 as Excel Worksheet
About our data
This report uses preliminary treatment and pregnancy data for 2020-2022 and preliminary birth outcome data for 2019-2022. This is because the HFEA has recently launched a new data submission system for licensed clinics and migrated our fertility treatment and outcomes data to a new database. This data migration has resulted in delays which has prevented the validation of the 2020-2022 treatment and pregnancy data and 2019-2022 birth outcome data. Because of this, these statistics cannot be classified as official statistics. Data validation involves data quality checks that verify treatment, pregnancy and birth outcome data. Data validation is expected to be complete by late 2024.
This report covers the period from 1991-2022 where data is available. Data for 1991 covers a partial year, starting in August 1991. The information that we publish is a snapshot of data provided to us by licensed clinics. The figures supplied in this report are from our data warehouse containing Register data as of 16 May 2024. Results are published according to the year in which the cycle was started. For further information, please see our Quality and Methodology report.
Unless stated otherwise, the data in this report refers to treatment cycles i.e. only those cycles which were begun with the intention of immediate treatment, instead of storing eggs or embryos for future use. Averages used are provided as mean values unless stated otherwise.
Patient counts in Table 2 of this report do not include patients who underwent IVF cycles where PGT-A or PGT-M has occurred or egg share cycles. This was not originally recorded in the data note. An update to the note has since been made. Please note these numbers may not directly compare to patient counts in other published sources (updated 25/11/2024).
About the HFEA
The HFEA is the UK’s independent regulator of fertility treatment and research using human embryos. Set up in 1990 by the Human Fertilisation and Embryology Act, the HFEA is responsible for licensing, monitoring, and inspecting fertility clinics and research centres – and taking enforcement action where necessary – to ensure everyone accessing fertility treatment receives high quality care.
The HFEA is an ‘arm’s length body’ of the Department of Health and Social Care, working independently from Government providing free, clear, and impartial information about fertility treatment, clinics and egg, sperm, and embryo donation.
The HFEA collects and verifies data on all treatments that take place in UK licensed clinics which can support scientific developments and research and service planning and delivery.
The HFEA is funded by licence fees, IVF treatment fees and a small grant from UK central government. For more information, visit hfea.gov.uk.
Contact us regarding this publication
Media: press.office@hfea.gov.uk
Statistical: intelligenceteam@hfea.gov.uk
Accessibility: comms@hfea.gov.uk
Footnotes
- Data validation involves quality checking data submitted from licensed clinics across the UK to that verify treatment, pregnancy and birth outcome data is correctly recorded on our data Register.
Notes on preliminary fertility treatment 2022: trends and figures
- ONS. Births by parents’ characteristics dataset, 2022 edition, Table 4 (2023).
- Royal College of Obstetricians and Gynaecologists (RCOG). Left for too long: understanding the scale and impact of gynaecology waiting lists (2022).
- Fertility Network UK. The impact of the cost-of-living crisis on UK fertility patients (2023).
- Tarlatzis, B. and Bili, H. Intracytoplasmic sperm injection. Survey of world results. Annals of the New York Academy of Sciences, Volume 900, pages 336-344 (2000).
- Andersen, A., Carlsen, E., Loft, A. Trends in the use of intracytoplasmatic sperm injection marked variability between countries. Human Reproduction Update, Volume 14, Issue 6. pages 593-604 (2008).
- Human Fertilisation and Embryology Act 2008, UK Public General Acts (2008).
- ONS. Births in England and Wales: 2022 (refreshed populations) (2024).
- National Records of Scotland (NRS). Annual births, deaths, marriages and other vital events report (2023).
- Northern Ireland Statistics and Research Agency (NISRA). Registrar General Annual Report 2022 (2023).
- Human Fertilisation and Embryology Authority (HFEA). Coronavirus (COVID-19) - previous updates for professionals, (2020-2021).
- National Guideline Alliance. A report by the National Guideline Alliance about twin pregnancy costing (2018).
- Monden, C., Pison, G., Smits, J. Twin Peaks: more twinning in humans than ever before. Human Reproduction, Volume 36, Issue 6, pages 1666–1673 (2021).
- Department of Health and Social Care (DHSC). Guidance: NHS-funded in vitro fertilisation (IVF) in England (2024).
| Publication date: |
|---|