Fertility treatment 2021: preliminary trends and figures
Preliminary UK statistics for IVF and DI treatment, storage, and donation
Published: June 2023
Download the underlying dataset as .xlsx
Table of contents
- Main points
- Note on preliminary data
- Section 1. Average IVF pregnancy rates using fresh embryo transfers increased for all ages
- Section 2. Average IVF pregnancy and birth rates using frozen embryo transfers increased over the past 30 years
- Section 3. Fertility treatments have returned to pre-pandemic levels
- Section 4. Multiple births from IVF at lowest UK average yet of 5%
- Section 5. Egg and embryo storage cycles continued to increase
- Section 6. Average age of IVF patients increased to 36 years
- Section 7. Increased use of fertility treatment across family types
- Section 8. NHS-funded IVF cycles remain below pre-pandemic levels for most age groups
- Section 9. NHS-funded IVF cycles decreased across the UK since 2019
- About our data
Main points
- Around 55,000 patients had in vitro fertilisation (IVF) or donor insemination (DI) treatment at HFEA licensed fertility centres in the UK in 2021, rising from around 53,000 patients in 2019.
- In 2021, all fertility service activity increased on pre-pandemic levels with total IVF and DI treatment cycles increasing by 10% from 2019.
- IVF cycles (fresh and frozen embryo transfers) increased to 76,000 cycles in 2021 from almost 70,000 in 2019 (+9%). DI cycles increased to 7,000 in 2021 from around 6,000 in 2019 (+22%).
- Average IVF pregnancy rates using fresh embryo transfers for patients aged 18-34 were 41% per embryo transferred, compared to 6% for patients aged 43-50 when using their own eggs in 2021.
- Preliminary average IVF birth rates using fresh embryo transfers for patients aged 18-34 were 33% per embryo transferred, compared to 4% for patients aged 43-50 when using their own eggs in 2021. The birth rate among younger patients is expected to increase following data validationI, as birth rates are typically three percentage points lower than pregnancy rates.
- In 2021, the average IVF pregnancy rate using frozen embryo transfers was 36% per embryo transferred and the average preliminary IVF birth rate was 27% per embryo transferred.
- In 2021, the UK average multiple birth rate reached the lowest level yet at 5%, falling from 28% in the 1990s.
- The number of egg storage cycles increased from around 2,500 in 2019 to over 4,200 in 2021 (+64%).
- The number of embryo storage cycles increased from around 8,300 in 2019 to over 10,700 in 2021 (+30%).
- The average age of IVF patients increased to 36 years old and DI patients’ average age was 34 in 2021. The overall average age that women in England and Wales had children was 30.9, according to the Office for National Statistics (ONS).
- Single patients and patients in female same-sex relationships increasingly used IVF and DI from 2019 to 2021, with the largest increases in IVF usage.
- The use of private funding by patients across the UK aged 18-34 has continued to increase with 63% of IVF funded privately in 2021 compared to 52% in 2019.
- The number of IVF cycles funded by the National Health Service (NHS) continued to vary across the UK with an overall decrease to 20,000 in 2021 from around 24,000 in 2019 (-16%).
Note on preliminary data
This report provides an update on fertility treatment and outcomes in the UK from 1991 to 2021. Due to the COVID-19 pandemic and large-scale work to upgrade the HFEA data submission system and migrate data to a new database, data on treatments and pregnancies from 2020-2021 and outcomes from 2019-2021 have not yet been validated. This means that some data in this report is preliminary and cannot be compared to other reports.
Sections of this report focus on short-term trends between 2019 and 2021 to provide an indication of how fertility treatments and those accessing treatments may have varied throughout and following the COVID-19 pandemic. It is too soon to provide information on the long-term impact of the COVID-19 pandemic on fertility treatments, but we have noted where this may have had an effect on the data presented in this report. See our Impact of COVID-19 on fertility treatment 2020 report for more information.
1. Average IVF pregnancy rates using fresh embryo transfers increased for all ages
In 2021, around 55,000 patients had almost 76,000 fresh and frozen embryo transfer IVF cycles and around 7,000 DI cycles at licensed fertility clinics in the UK.
The average overall pregnancy rate from IVF using fresh embryo transfers increased from 10% per embryo transferred in 1991 to 29% in 2021. Patients aged 18-34 had the highest pregnancy rate per embryo transferred at 41% in 2021 (Figure 1). Pregnancy rates per embryo transferred increased from 8% in 1991 to 33% for patients aged 35-37, and 25% for patients aged 38-39 in 2021. For patients aged 40-42 pregnancy rate per embryo transferred increased from 6% in 1991 to 16% in 2021. For patients aged 43-50 pregnancy rate per embryo transferred increased from 1% in 1991 to 6% in 2021.
Rising pregnancy rates for all age groups are likely due to improved clinical and laboratory practice. For more detailed information on pregnancy rates for fresh and frozen embryo transfer IVF cycles see the underlying dataset.
Figure 1. IVF pregnancy rate using fresh embryo transfers increased for all patient ages over the last 30 years
Average fresh embryo transfer IVF pregnancy rate per embryo transferred using patient eggs by age group, 1991-2021 (preliminary 2020-2021 data)
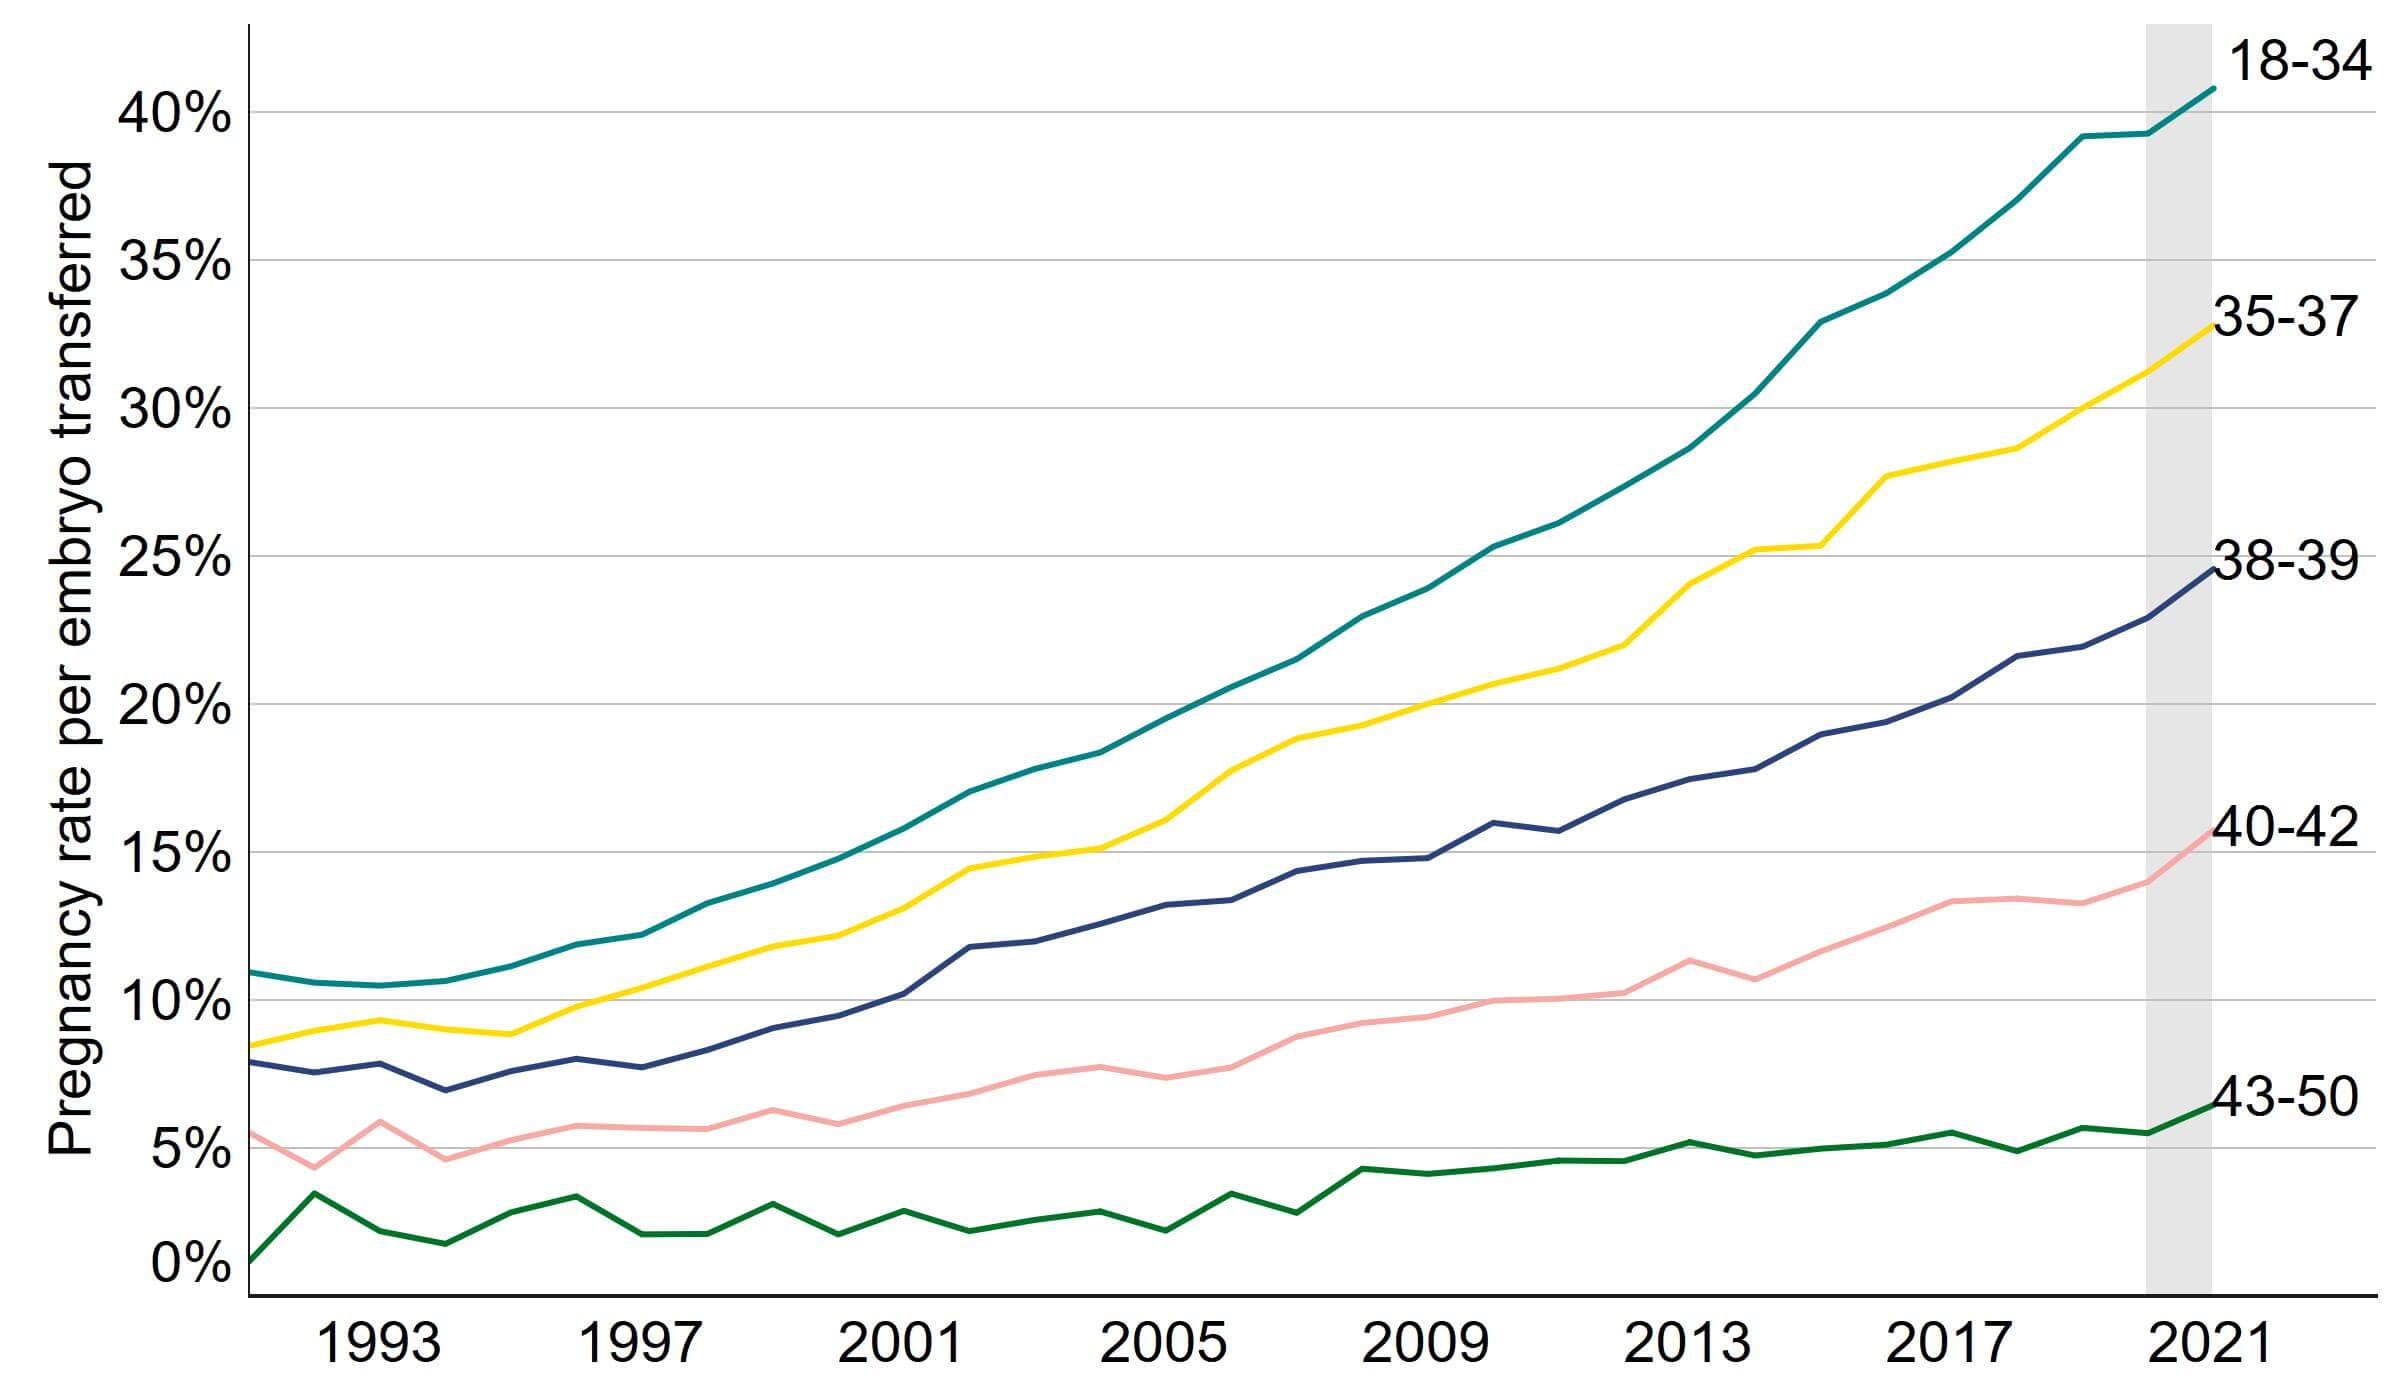
Note figure 1: Pregnancy rates for 2020 and 2021 are preliminary and have not been validated (grey band). This data includes IVF treatment cycles begun with the intention of having a live birth only and includes fresh embryo transfers. PGT-A/M/SR treatments and treatments using donor eggs or surrogacy have been excluded.
Download the underlying data for Figure 1 as Excel Worksheet
The average birth rate from IVF using fresh embryo transfers increased from 8% per embryo transferred in 1991 to a preliminary 22% in 2021 (Figure 2). The preliminary birth rates currently show that the birth rates remained similar or slightly decreased from 2018 to 2021. It is expected that the birth rates will increase following data validationI, as birth rates are typically three percentage points lower than pregnancy rates. In the meantime, we suggest using pregnancy rates as an indicator for progress in recent years.
Patients aged 18-34 had the highest average fresh embryo transfer IVF birth rate per embryo transferred at 33% in 2021. Live birth rates per embryo transferred increased from 7% in 1991 to 25% in 2021 for patients aged 35-37 and increased from 6% in 1991 to 17% in 2021 for patients aged 38-39. For patients aged 40-42 birth rate per embryo transferred increased from 3% in 1991 to 10% in 2021. Birth rate per embryo transferred remained similar for patients aged 43-50, with an average of 4% in 2021. For more detailed information on birth rates for fresh and frozen embryo transfer IVF cycles see the underlying dataset. Although live birth rates have increased steadily over the past three decades, not all patients have the same likelihood of a live birth. For example, our report on Ethnic diversity in fertility treatment 2018 shows variation in outcomes by ethnicity.
Figure 2. IVF birth rate using fresh embryo transfers increased or remained similar across all age groups
Average fresh embryo transfer IVF birth rate per embryo transferred using patient eggs by age group, 1991-2021 (preliminary 2019-2021 data)
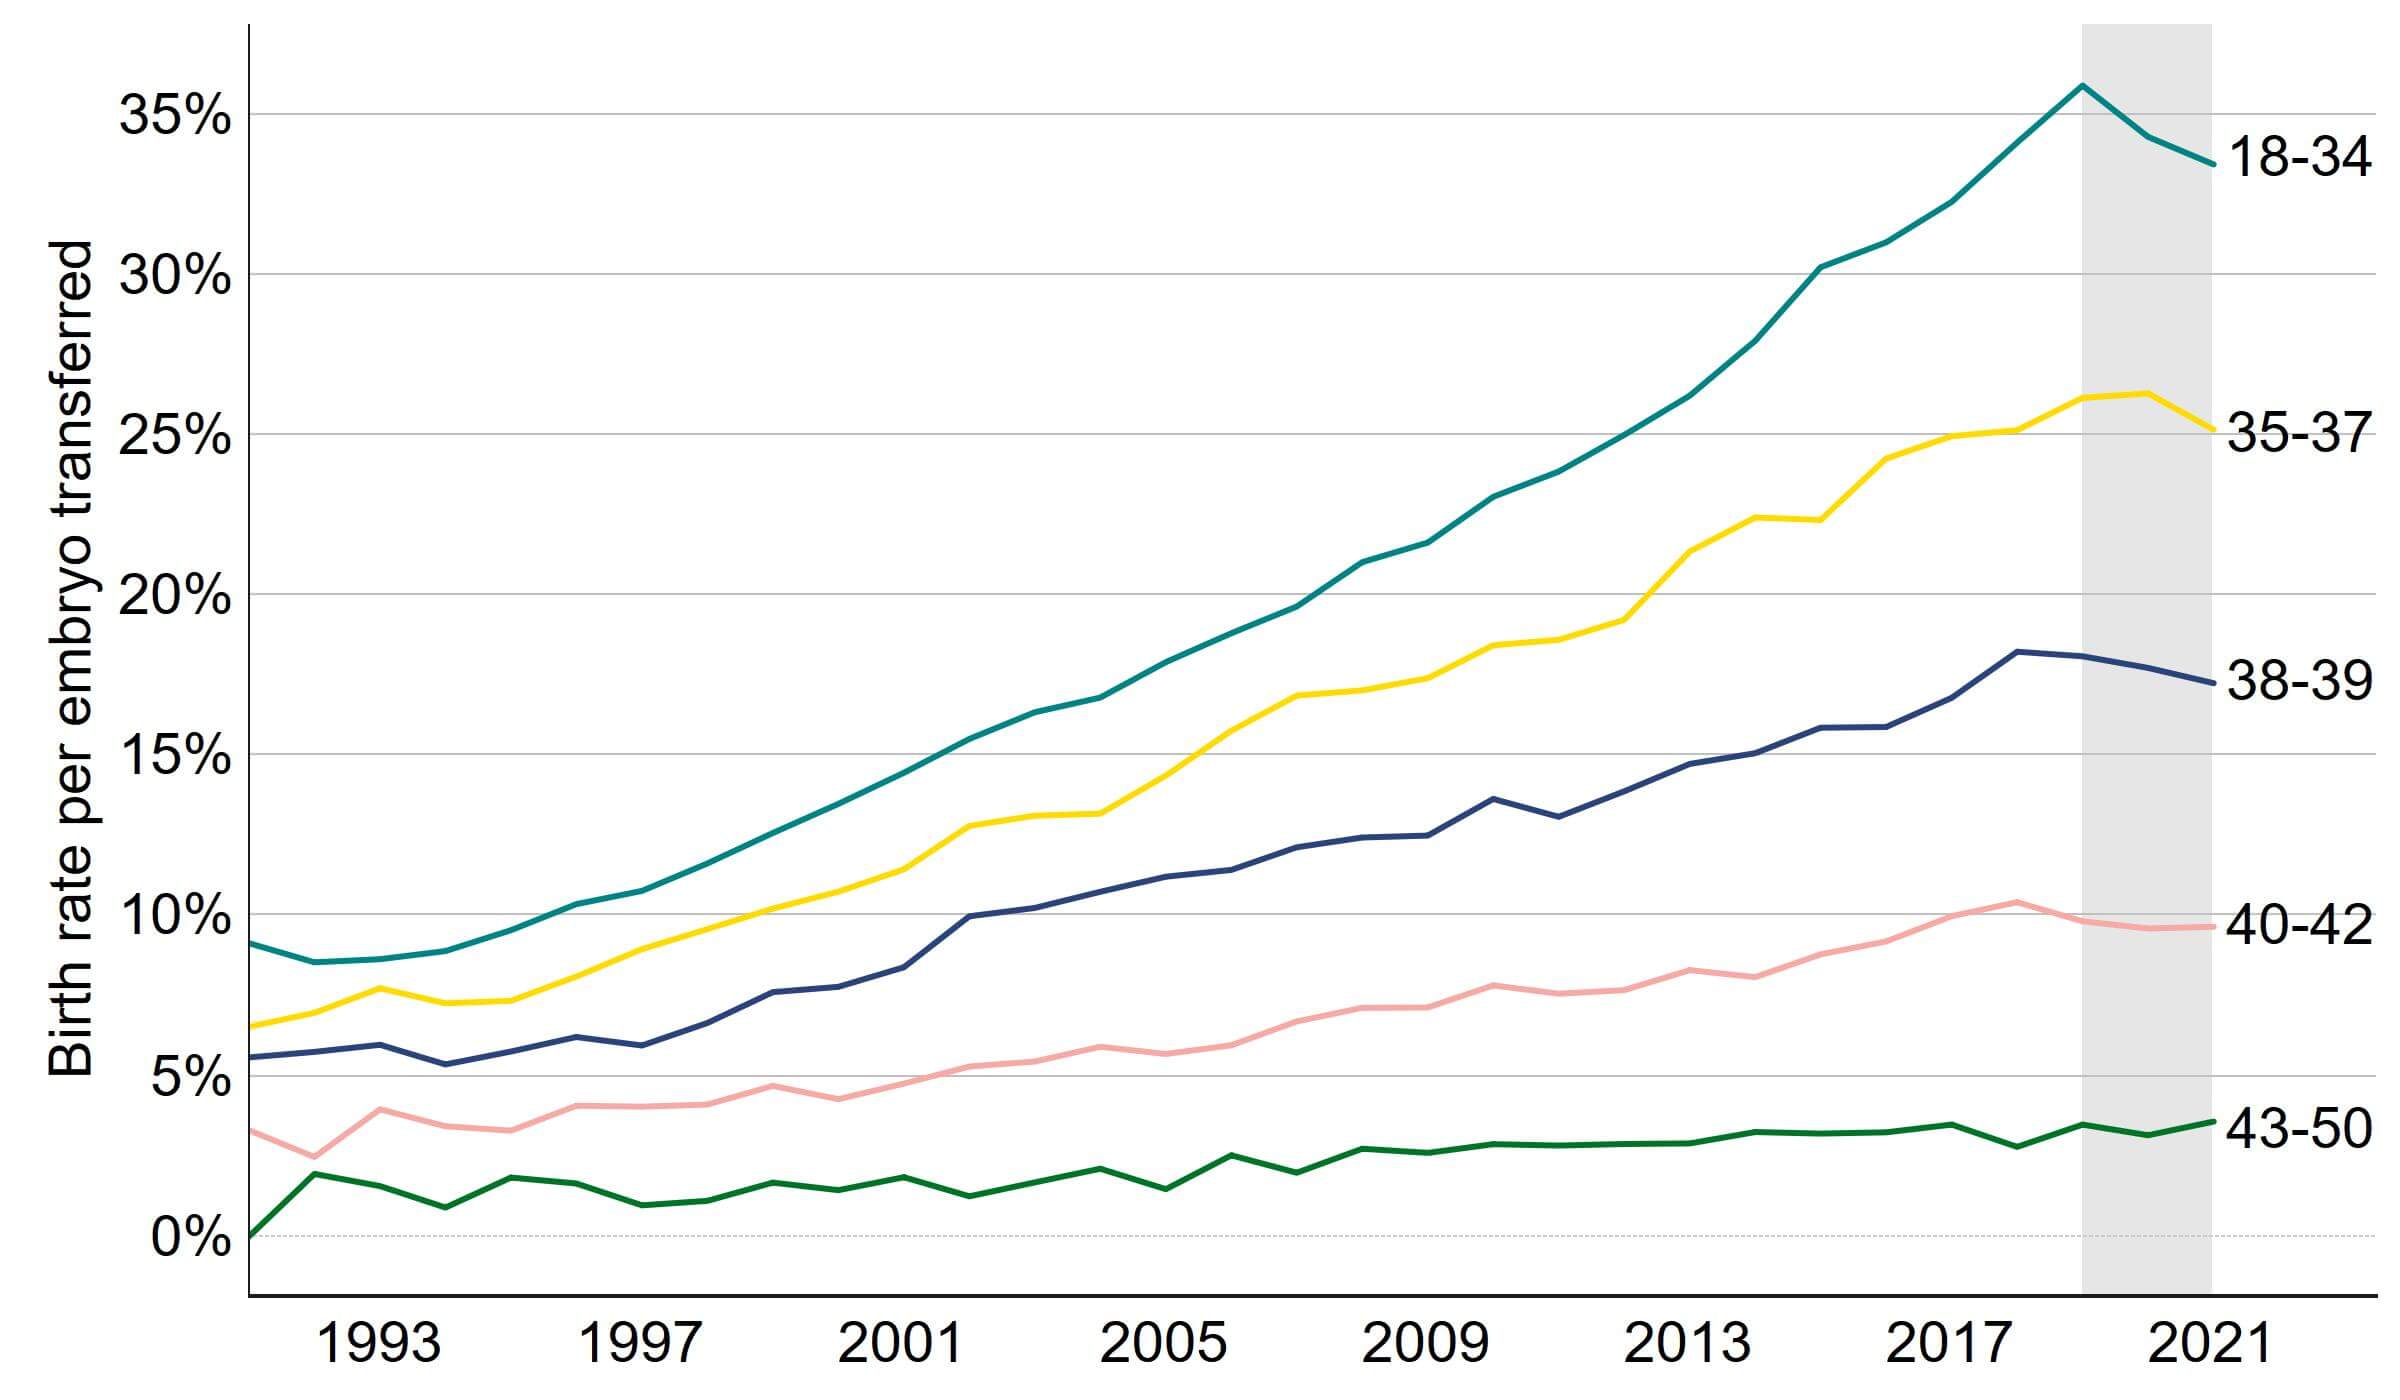
Note figure 2: Birth rates for 2019, 2020 and 2021 are preliminary and have not been validated (grey band). This data includes IVF treatment cycles begun with the intention of having a live birth only and includes fresh embryo transfers. Treatments in which a pregnancy was recorded and no birth outcome recorded have been excluded. PGT-A/M/SR treatments and treatments using donor eggs or surrogacy have been excluded. Decreases in IVF birth rates from 2020-2021 are likely due to missing outcome data and are expected to increase following data validationI.
Download the underlying data for Figure 2 as Excel Worksheet
2. Average IVF pregnancy and birth rates using frozen embryo transfers increased over the past 30 years
As freezing techniques have improved, a typical patient today will have a single fresh embryo transferred in their first cycle, and any additional embryos of suitable quality can be stored for use in subsequent cycles. Frozen embryo transfer IVF cycles have increased in use with a 41% increase from 2017 to 2021, while fresh embryo transfers decreased by 8% in the same period (see section 3).
The average IVF pregnancy rate using frozen embryo transfers increased from around 7% in the 1990s to 36% in 2021 (Figure 3). The average IVF birth rate using frozen embryo transfers increased from around 6% in the 1990s to 27% in 2021. The preliminary birth rate currently shows that the birth rate remained similar from 2018 to 2021. It is expected that the birth rate in recent years will increase following data validationI. When using frozen embryo transfer data, pregnancy and birth rates are largely dependent on the age of the patient at embryo freezing rather than age at embryo transfer.
Figure 3. IVF pregnancy and birth rates using frozen embryo transfers have increased or remained similar
Average frozen embryo transfer IVF pregnancy and birth rates per embryo transferred using patient eggs, 1991-2021 (preliminary 2019-2021 data)
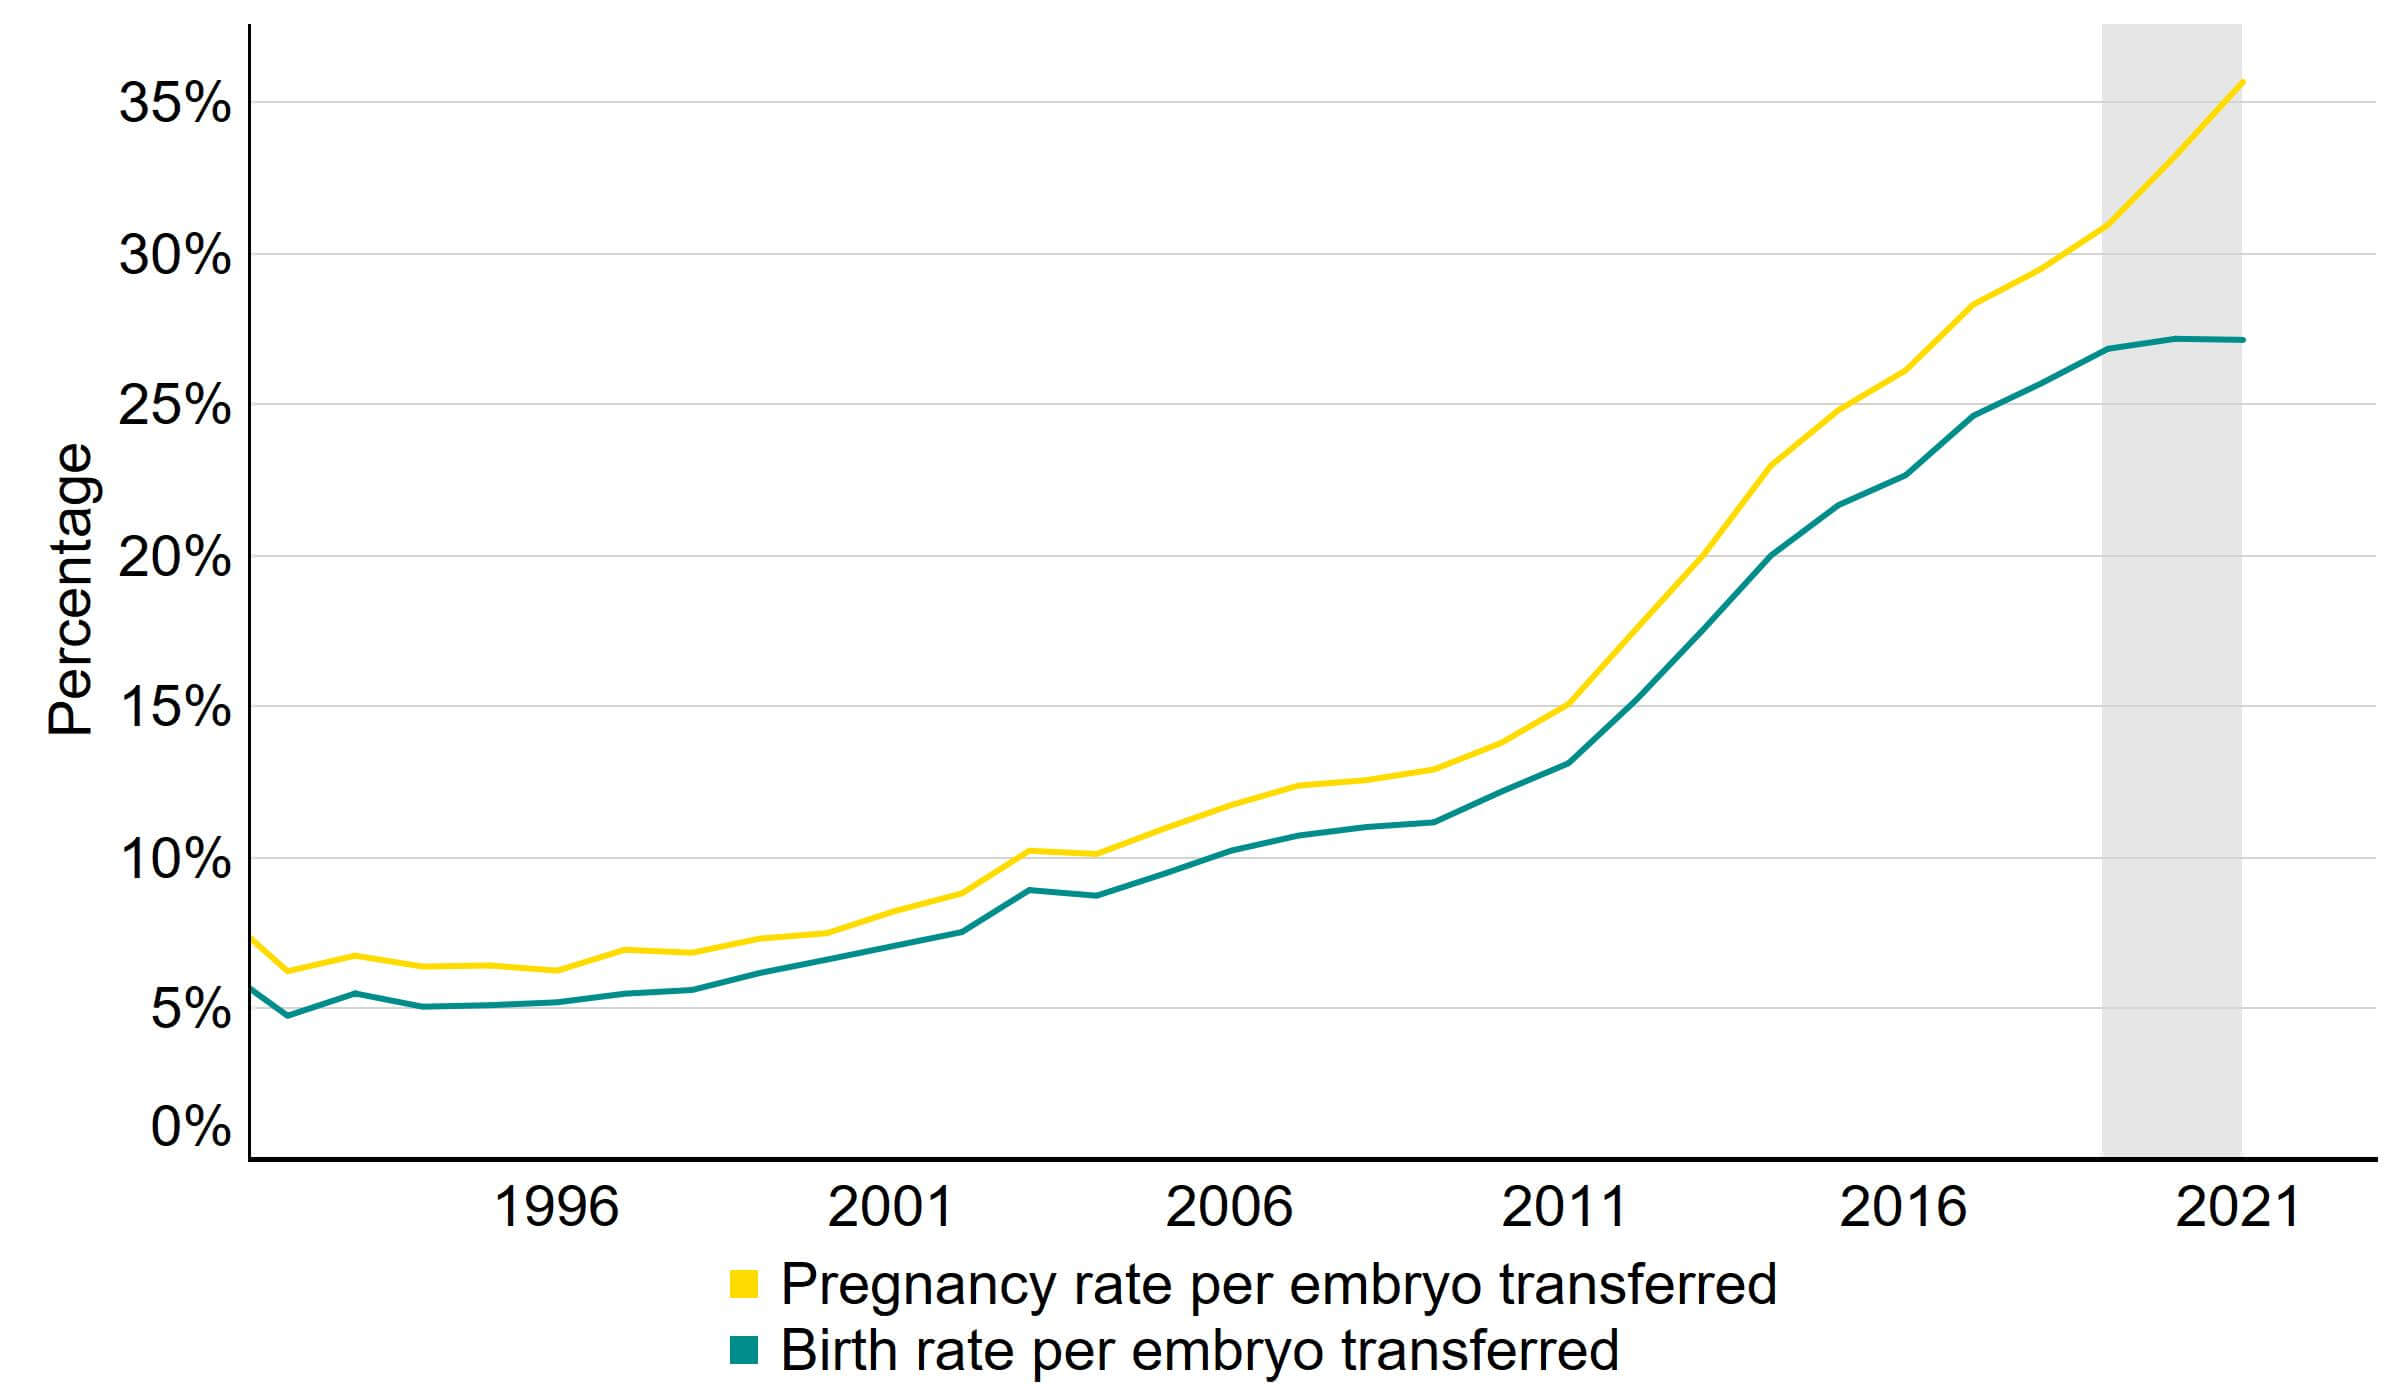
Note figure 3: Pregnancy rates for 2020 and 2021 and birth rates for 2019, 2020 and 2021 are preliminary and have not been validated (grey band). This data includes IVF treatment cycles begun with the intention of having a live birth only and includes frozen embryo transfers. Treatments in which a pregnancy was recorded and no birth outcome recorded have been excluded. PGT-A/M/SR treatments and treatments using donor eggs or surrogacy have been excluded.
Download the underlying data for Figure 3 as Excel Worksheet
3. Fertility treatments have returned to pre-pandemic levels
In response to COVID-19, fertility treatments across the UK were suspended from 15 April to 11 May 2020, except for where urgent fertility preservation was taking place. Many clinics were able to restart treatments quickly, adapting and introducing new ways of delivering safe services. This meant that the UK fertility sector was the first elective medical sector to reopen during the pandemic. See our Impact of COVID-19 on fertility treatment 2020 report for more information.
Preliminary data from 2021 suggests that all treatments had returned to pre-pandemic levels (Table 1), with IVF and DI cycles increasing overall by 10% from 2019 to 2021. Fresh embryo transfer IVF increased by 3% and frozen embryo transfer IVF increased by 18% from 2019 to 2021. The larger increase in frozen embryo transfer IVF is consistent with longer term trends and will be due in part to increased use of single embryo transfers over the last decade, as well as increased use due to policies in clinics during COVID-19. (see section 4 and Multiple births in fertility treatment 2019 report). Frozen embryo transfer cycles accounted for 34% of all IVF cycles in 2017 compared to 44% in 2021. DI cycles increased by 22% from 2019 to 2021.
Embryo storage cycles were the only activity that increased in 2020, rising from 8,268 in 2019 to 8,878 in 2020 (+7%). In 2021, embryo storage cycles increased to 10,719 (+30% from 2019). Egg storage cycles increased from 2,576 in 2019 to 4,215 in 2021 (+64%). See section 5 for more information on egg and embryo storage.
The total number of new egg and sperm donors decreased by 7% from 2019 to 2021. New donor registrations have decreased in recent years due to the COVID-19 pandemic. There are typically fewer sperm donors per year than egg donors as sperm donors tend to provide multiple donations. See our Trends in egg, sperm and embryo donation 2020 report for more information.
| Table 1. Most activities had reached pre-pandemic levels | ||||
|---|---|---|---|---|
| Number of cycles by intended activity and new egg and sperm donors 2019-2021 (preliminary 2020-2021 data) | ||||
| 2019 | 2020* | 2021* | % change 2019 to 2021* | |
| IVF – fresh embryo transfer | 40,946 | 30,259 | 42,121 | +3% |
| IVF – frozen embryo transfer | 28,477 | 25,430 | 33,490 | +18% |
| DI | 5,810 | 5,384 | 7,069 | +22% |
| Treatment total | 75,233 | 61,073 | 82,680 | +10% |
| Egg storage | 2,576 | 2,447 | 4,215 | +64% |
| Embryo storage | 8,268 | 8,878 | 10,719 | +30% |
| Storage total | 10,844 | 11,325 | 14,934 | +38% |
| New egg donors | 1,495 | 1,155 | 1,409 | -6% |
| New sperm donors | 841 | 780 | 768 | -9% |
| New donors total | 2,336 | 1,935 | 2,177 | -7% |
| Note table 1: Treatment cycles only include cycles begun with the intention of having a live birth only and are preliminary for 2020 and 2021 (*). This data uses new egg and sperm donor registrations only. Donors that registered multiple times will only be counted in the year of their first registration. Classification of egg storage and embryo storage cycles has changed, see Quality and Methodology report, and cannot be directly compared to previous reports. | ||||
Download the underlying data for Table 1 as Excel Worksheet
4. Multiple births from IVF at lowest UK average yet of 5%
Multiple births cause increased risk of health problems for patients and their babies, such as late miscarriage, premature delivery, gestational diabetes, still birth and neonatal and maternal death. In the early 1990s the average UK multiple birth rate from IVF was around 28%, compared to 1-2% in natural conception.1 Following the launch of the ‘One at a time’ campaign in 2007 and introduction of multiple birth rate targets for the sector in 2009, a 10% target was reached in 2017.
In 2021, the preliminary average multiple birth rate decreased to the lowest UK average yet of 5% in 2021 (Figure 4). For patients aged 43-50, the multiple birth rate had the largest decrease from 26% in 2007 to 3% in 2021.
Importantly, birth rates have continued to rise while the multiple birth rate has fallen. This may be due in part to increased use of single embryos at day five of development (blastocyst). Blastocyst embryos have been increasingly used in the UK and may have helped to maintain birth rates from single embryo transfer while decreasing multiple birth rates. See our Multiple births in fertility treatment 2019 report for more information.
Figure 4. Average IVF multiple birth rate reduced further to 5% in 2021
IVF average live multiple birth rate, 1991-2021 (preliminary 2019-2021 data)
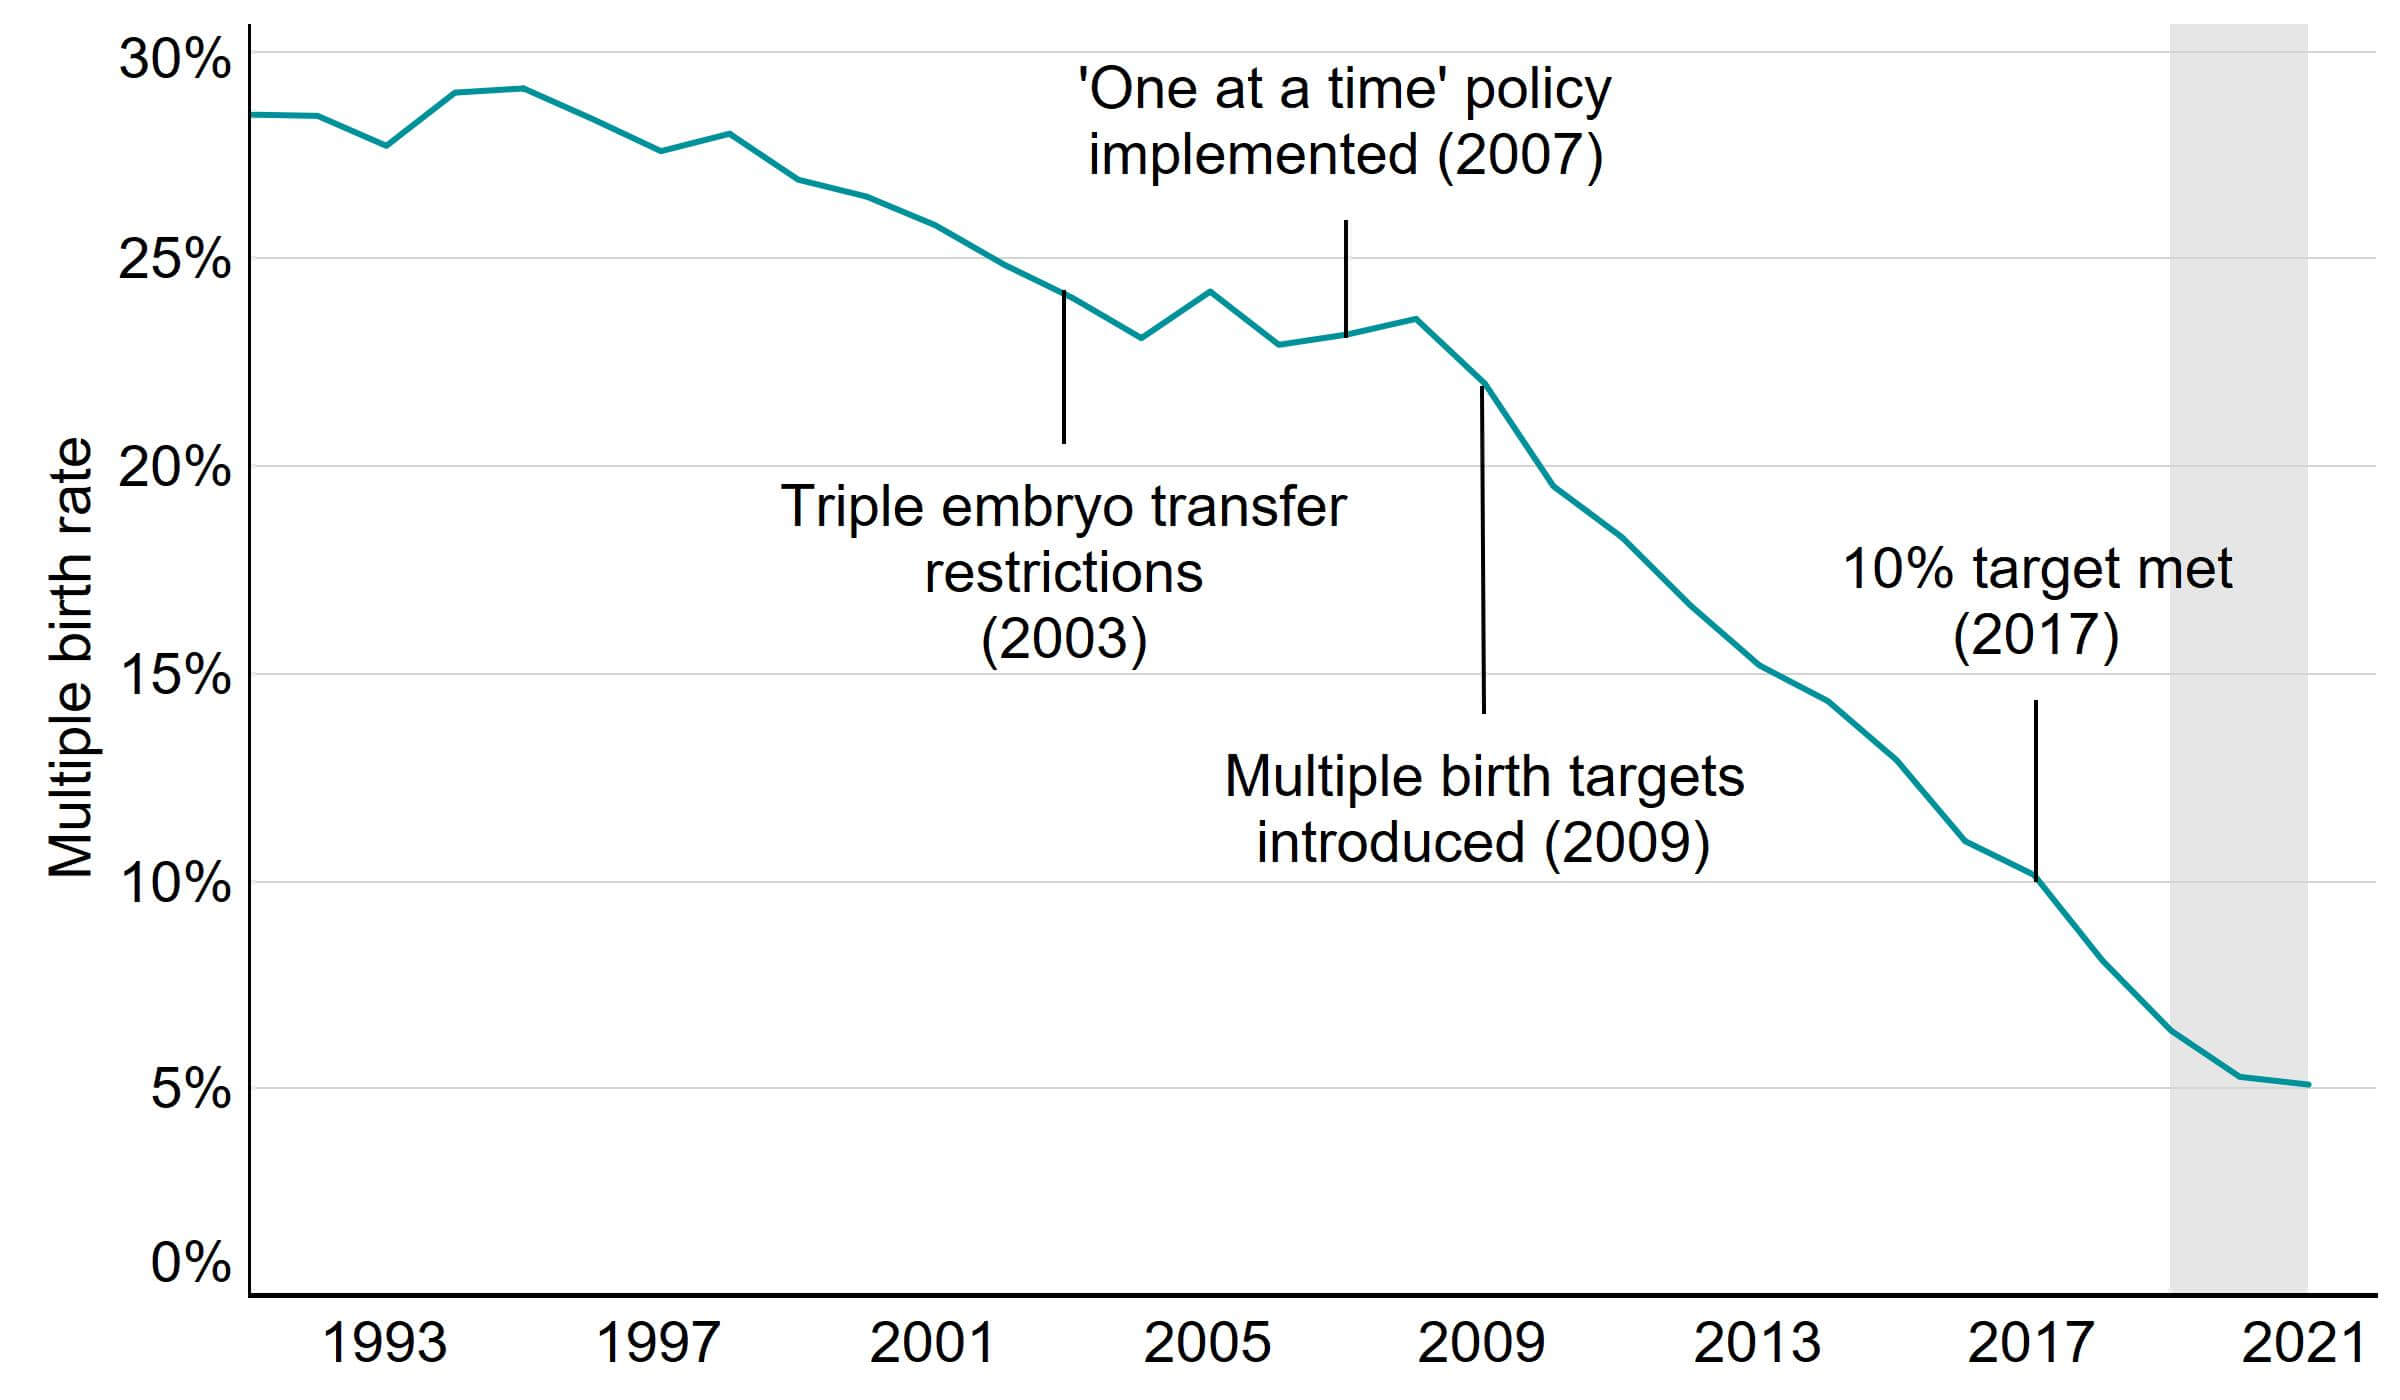
Note figure 4: Multiple birth rates for 2020 and 2021 are preliminary and have not been validated (grey band). This data includes IVF treatment cycles begun with the intention of having a live birth only and includes cycles using either patient or donor eggs. Treatments in which a pregnancy was recorded and no birth outcome recorded have been excluded.
Download the underlying data for Figure 4 as Excel Worksheet
5. Egg and embryo storage cycles continued to increase
Most patients using fertility services do so with the intention of trying to conceive as soon as possible. However, there are other reasons people may use fertility services, such as freezing eggs, sperm, or embryos so that they can hopefully have a biological family in the future. This provides an opportunity for patients to preserve fertility for medical reasons or for patients who want to freeze their eggs to have a family later in life.
On 1 July 2022, the rules on the length of egg, sperm or embryo storage changed. Before 1 July 2022, most people could store their eggs, sperm, or embryos for up to ten years, with exceptions for premature infertility or those having medical treatment which could affect their fertility. The law now permits storage of eggs, sperm, or embryos for use in treatment for any period up to a maximum of 55 years, providing patients renew consent every ten years. This means that people now have more time to make important decisions about their future.
Egg and embryo storage cycles are the fastest growing fertility treatments in the UK. Egg storage cycles increased from 373 cycles in 2011 to 4,215 cycles in 2021, while embryo storage cycles increased from 230 cycles to 10,719 cycles (Figure 5). Despite these large increases, egg storage cycles accounted for only 4% of all treatments carried out in 2021 and embryo storage cycles accounted for 11%.
Non-elective fertility preservation was the only treatment permitted when clinics were suspended due to the COVID-19 pandemic which will have led to storage cycles continuing to increase through 2020 (see section 3). Patients may also have chosen to freeze all their embryos rather than have immediate treatment during the pandemic.2
Figure 5. Egg and embryo storage cycles continued to increase
Number of egg and embryo storage cycles, 2011-2021 (preliminary 2020-2021 data)
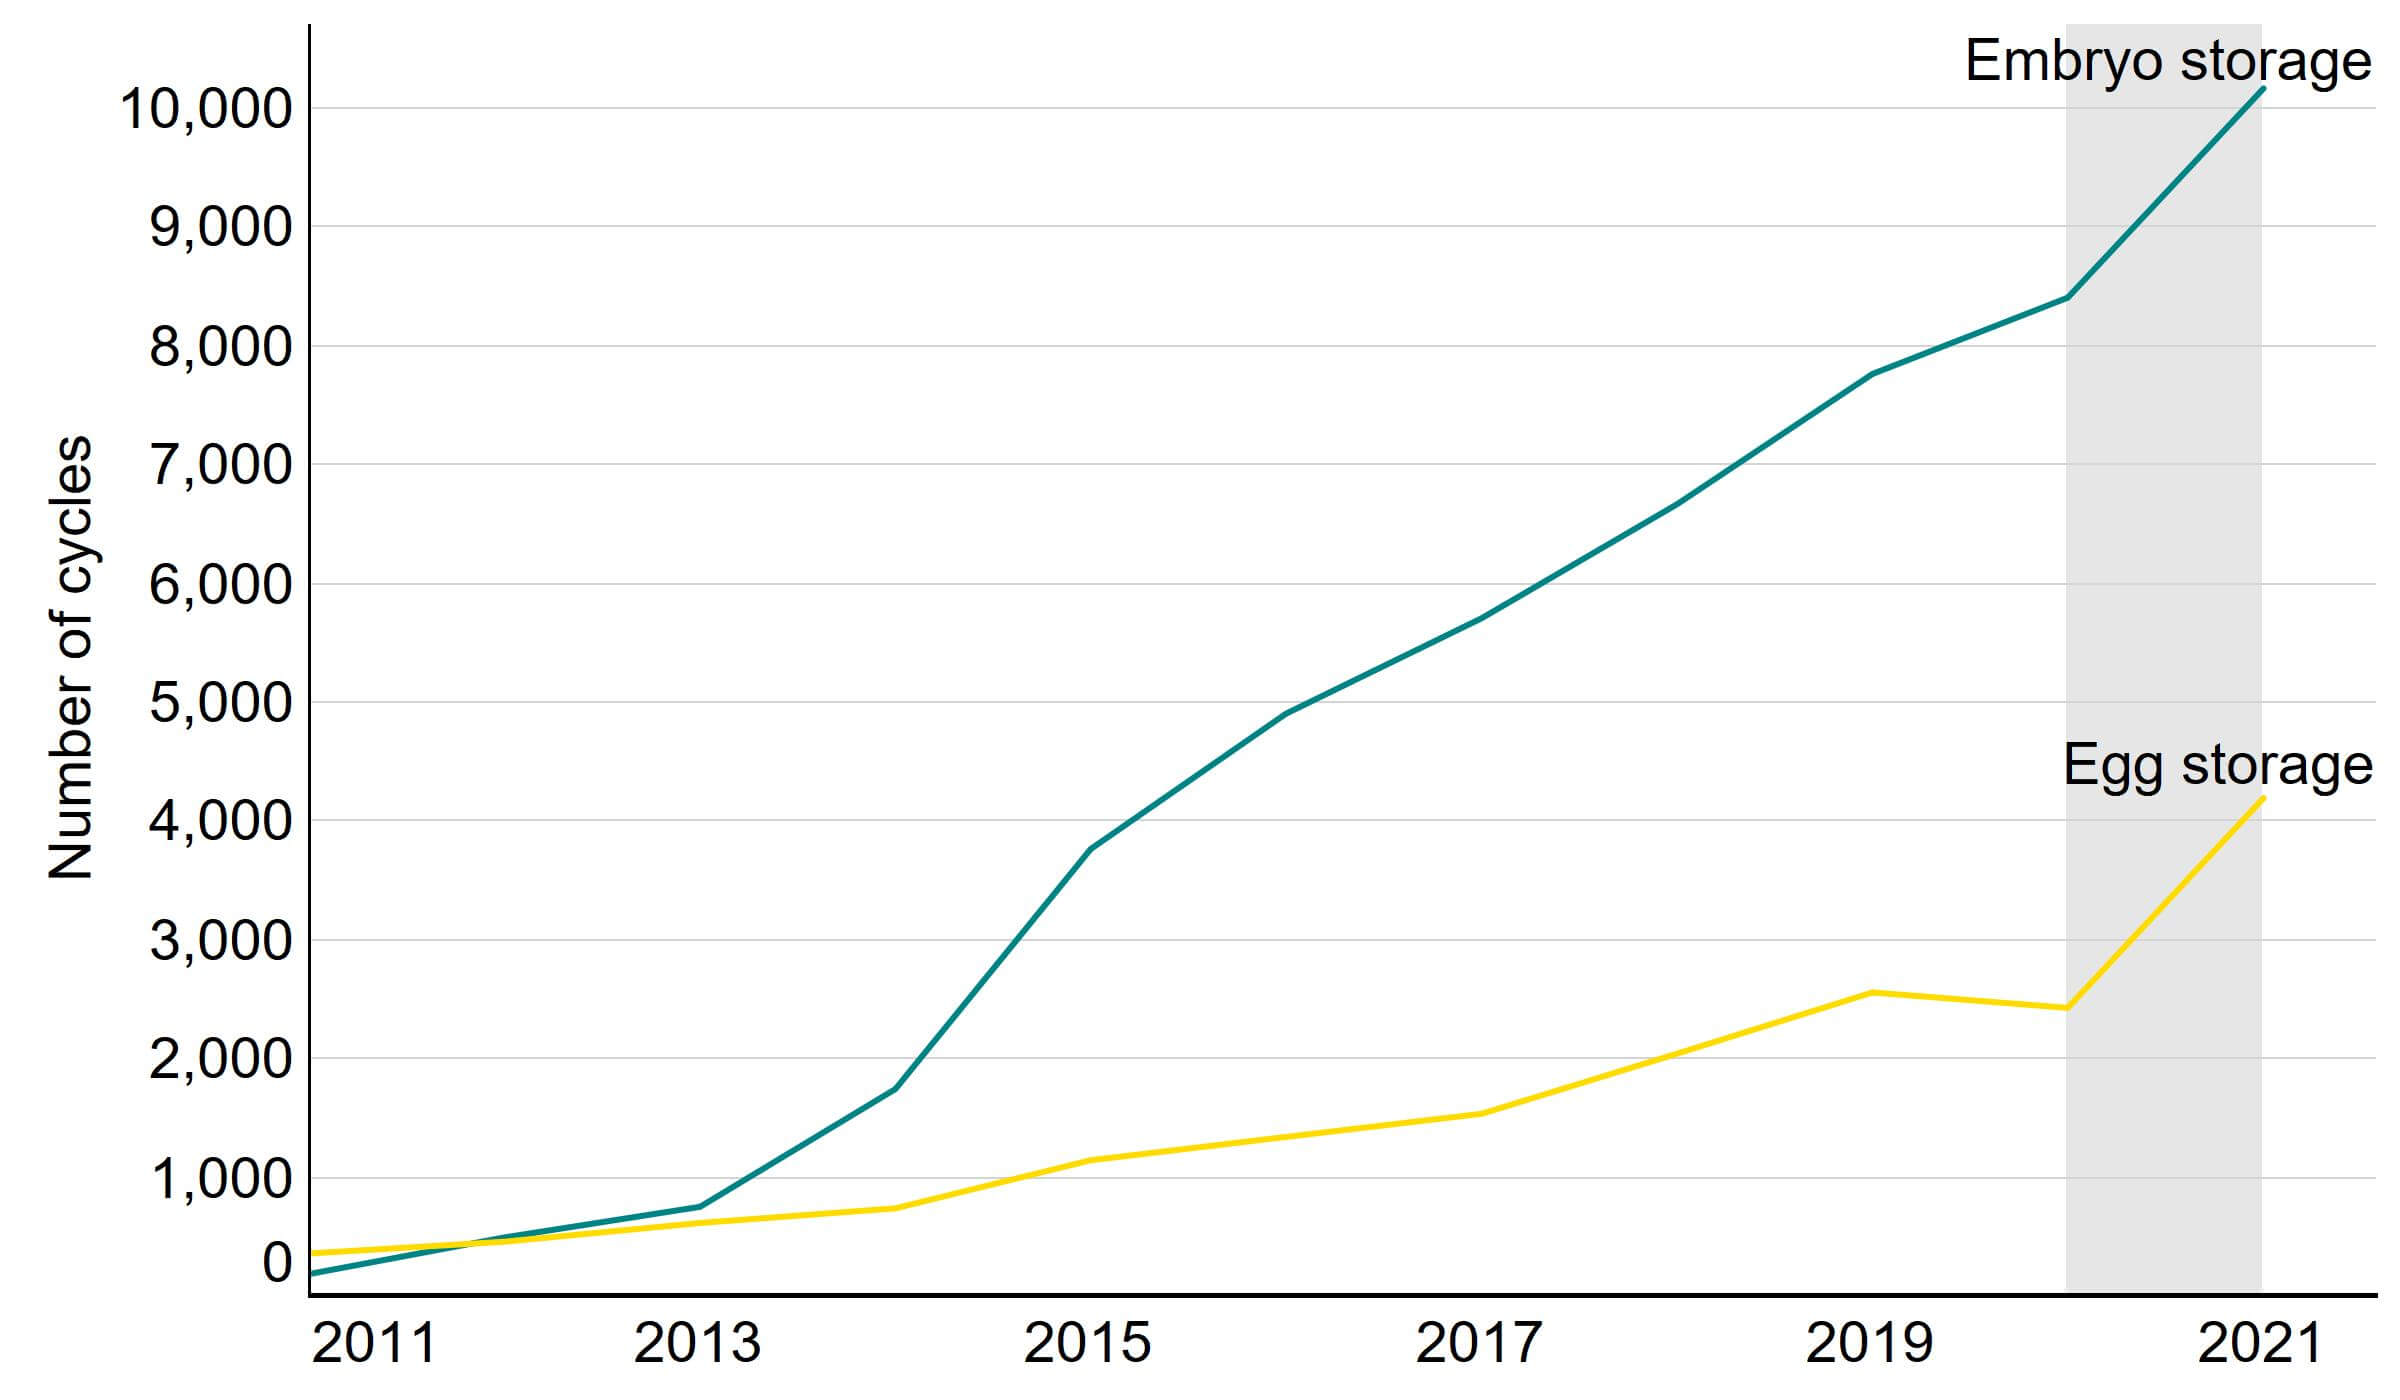
Note figure 5: Data includes cycles that intended to store patient eggs or embryos only and is preliminary for 2020 and 2021 (grey band). Classification of egg storage and embryo storage cycles has changed, see Quality and Methodology report, and cannot be directly compared to previous reports.
Download the underlying data for Figure 5 as Excel Worksheet
6. Average age of IVF patients increased to 36 years
In 2021, the average age of IVF patients was 36.0 years old and 34.3 for DI patients (Figure 6). This compares to the overall average age that women in England and Wales have children which increased to 30.9 in 2021.3
In 2011, the average age of patients undergoing IVF and DI was the same (35.2). From 2011 to 2021, there was an increase in the average age of patients undergoing IVF (+0.8 years) and this was the highest average patient age since data collection began in 1991. The average IVF patient age may continue to rise due to the COVID-19 pandemic. Despite fertility services being the first elective health service to re-open in the first stages of the pandemic, the knock-on effect of delays across other areas of healthcare, particularly gynaecology, has meant that some patients will be experiencing delays in accessing fertility services.4
The number of DI cycles were impacted less by the COVID-19 pandemic (see section 3). The average age of patients undergoing DI had decreased (-0.9 years) from 2011 to 2021. This was likely related to the changing family types accessing treatment following legislative changes in 2008 (see section 7).4 In 2021, patients in female same-sex relationships undergoing DI had the lowest average age at 32.9, followed by patients with a male partner at 33.5 and single patients with the highest at 36.1.
Figure 6. Average patient age increased to 36 for patients undergoing IVF
Average patient age by treatment type, 1991-2021 (preliminary 2020-2021 data)
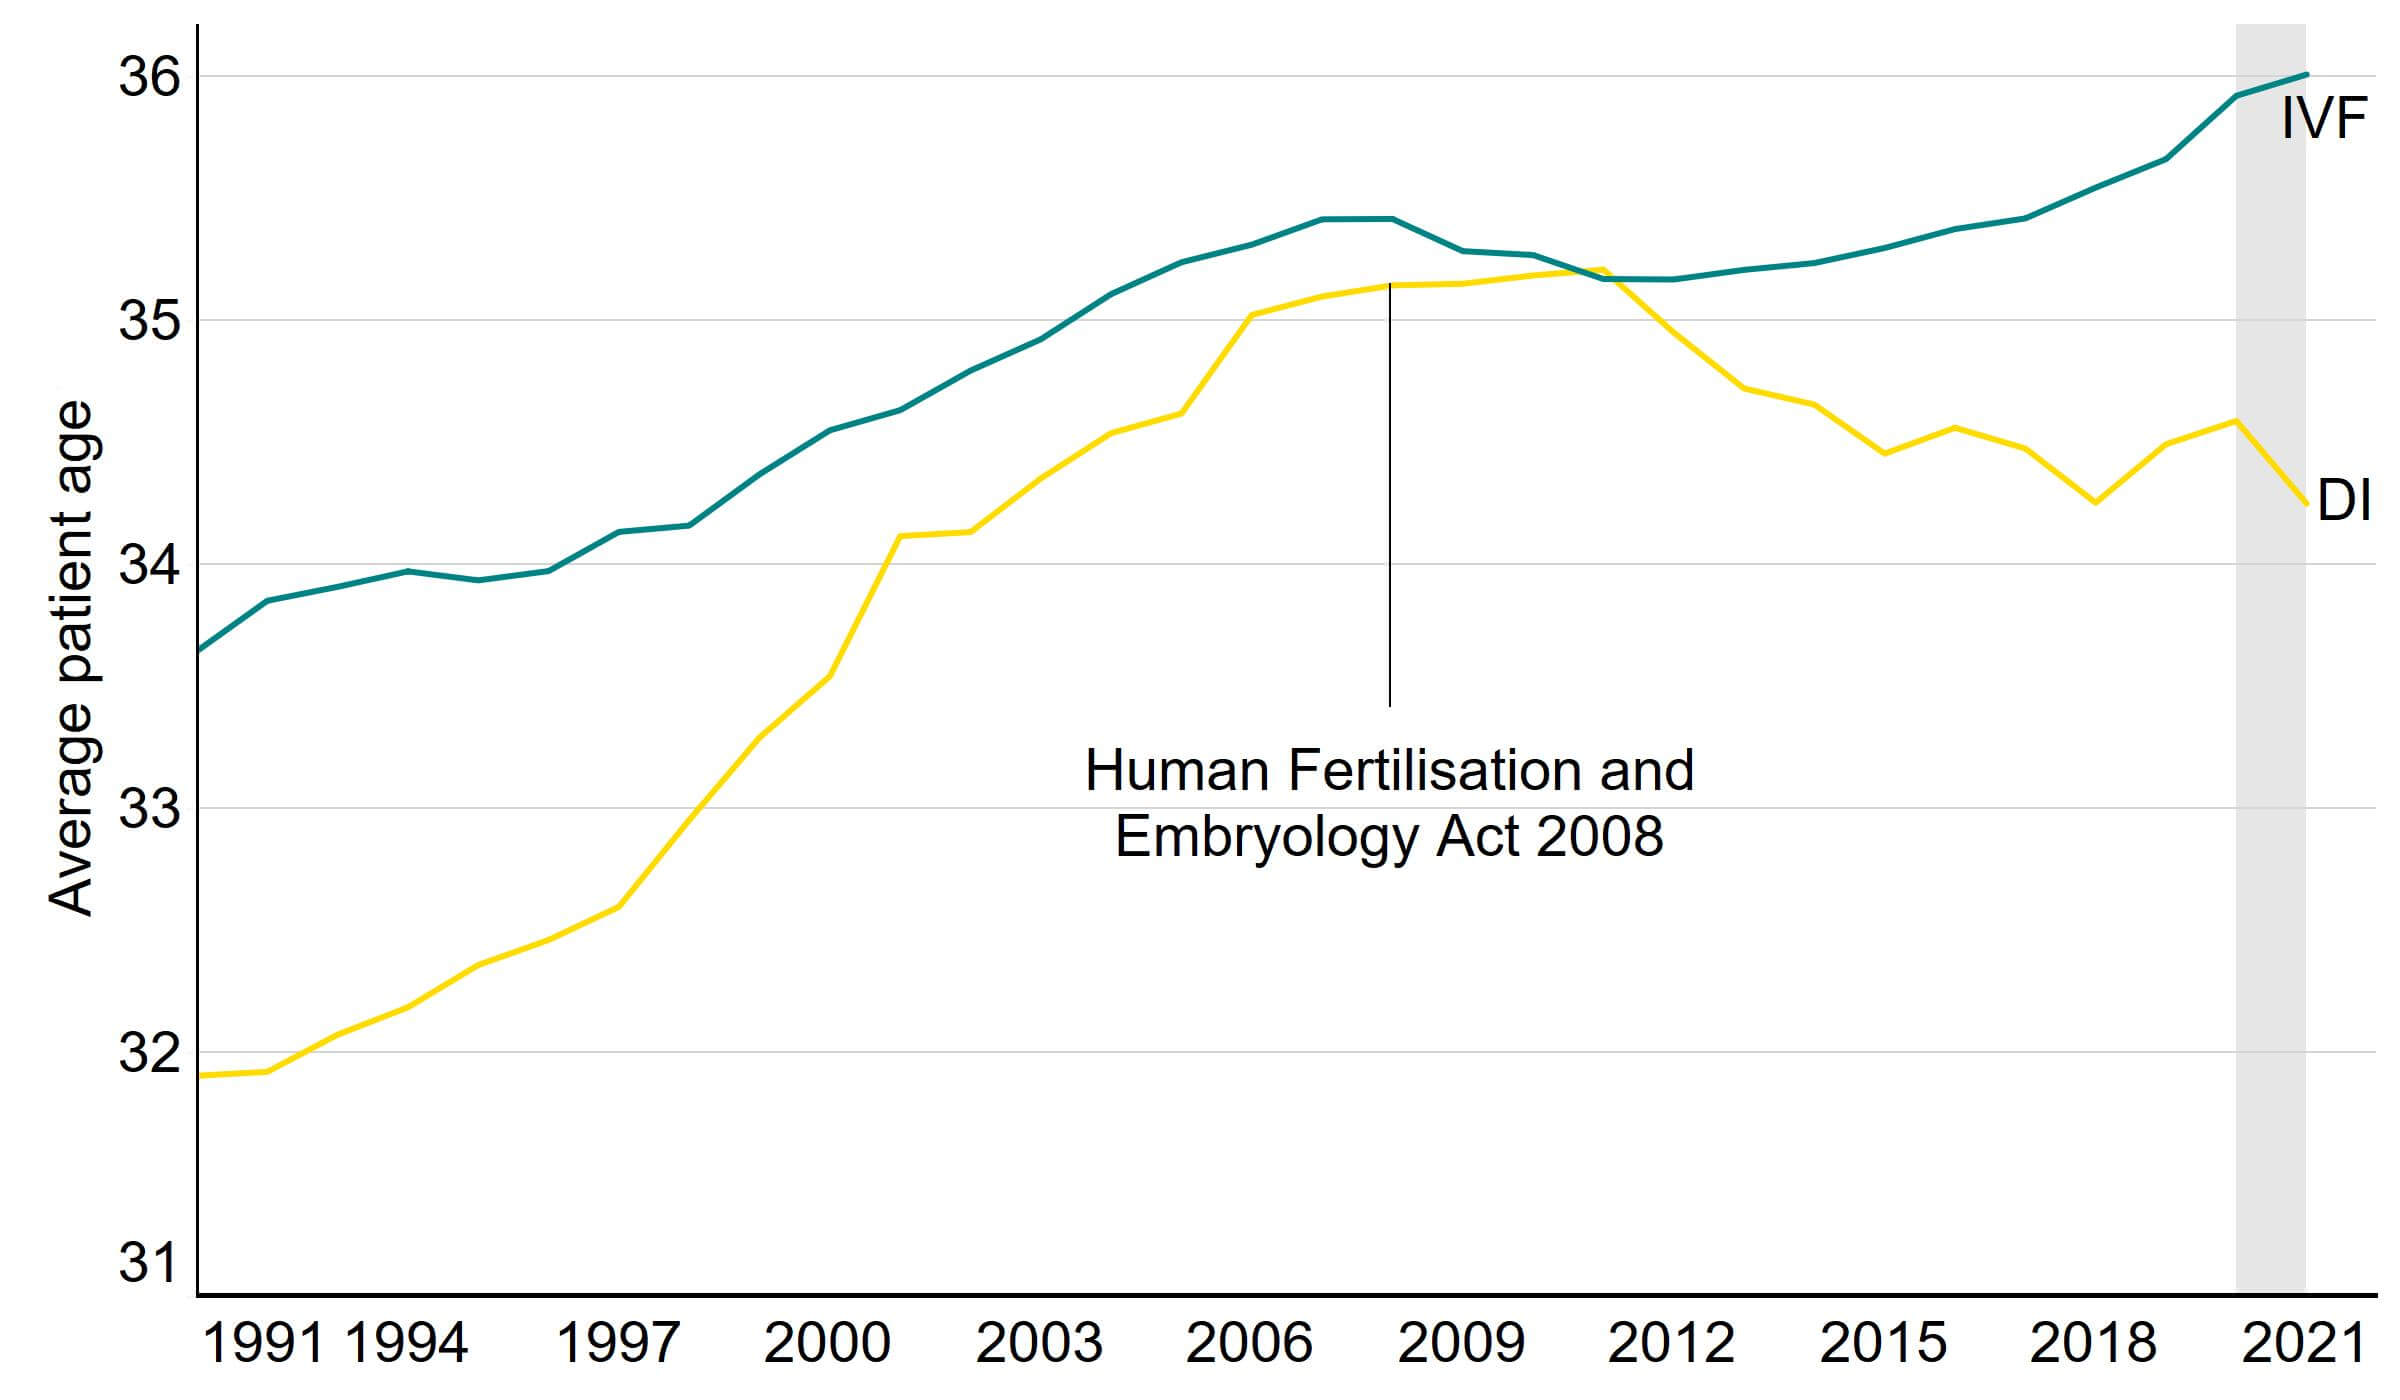
Note figure 6: Only includes patients undergoing treatment with the intention of having a live birth only. Average age for patients is preliminary for 2020 and 2021 (grey band).
Download the underlying data for Figure 6 as Excel Worksheet
7. Increased use of fertility treatment across family types
Patients in heterosexual relationships accounted for 90% of all IVF patients in 2021 and remained similar from 2019 to 2021 (+2%) (Table 2). The number of IVF patients in female same-sex relationships increased from 1,649 in 2019 to 2,201 in 2021 (+33%) and single patients increased from 2,001 in 2019 to 2,888 in 2021 (+44%). The number of surrogates declined from 266 in 2019 to 248 in 2021 (-7%). The increased use of IVF for patients in female same-sex relationships and single patients may relate to the cost of funding multiple DI cycles prior to accessing NHS-funded IVF treatment in some regions or nations (see Family formations in fertility treatment 2018 report).
In 2021, patients in female same-sex relationships accounted for the largest proportion (44%) of patients undergoing DI, followed by single patients (42%) and patients in heterosexual relationships (14%). Patients in heterosexual couples are likely to use DI in cases of severe male factor infertility. The number of patients in female same-sex relationships or single patients undergoing DI increased from 2,531 in 2019 to 3,069 in 2021. See our Trends in egg, sperm and embryo donation 2020 report for more information.
| Table 2. Changing family types are accessing fertility treatment | |||||
|---|---|---|---|---|---|
| Number of patients by treatment and partner type, 2019-2021 (preliminary 2020-2021 data) | |||||
| Treatment | 2019 | 2020* | 2021* | % change 2019 to 2021* |
|
| IVF | Male partner | 46,035 | 37,357 | 46,911 | +2% |
| Female partner | 1,649 | 1,624 | 2,201 | +33% | |
| No partner | 2,001 | 1,986 | 2,888 | +44% | |
| Surrogate | 266 | 229 | 248 | -7% | |
| DI | Male partner | 507 | 407 | 485 | -4% |
| Female partner | 1,334 | 1,272 | 1,565 | +17% | |
| No partner | 1,197 | 1,136 | 1,504 | +26% | |
| Note table 2: Number of patients is a distinct count. This means if a patient underwent two cycles in the same year they would be counted once. If they underwent a cycle in 2019 and then again in 2021, they would be counted once in each of these years. Data is preliminary for 2020 and 2021 (*). Includes patients undergoing treatment with the intention of having a live birth only. Data on intended parents is not available on the Register. | |||||
Download the underlying data for Table 2 as Excel Worksheet
8. NHS-funded IVF cycles remain below pre-pandemic levels for most age groups
During the COVID-19 pandemic, the number of IVF cycles in the UK decreased for all age groups, impacting younger patients the most. While the number of NHS-funded IVF cycles increased for all patients from 2020 to 2021, the number of NHS-funded cycles remained below pre-pandemic levels (Figure 7).
In recent years patients aged 18-34 increasingly used private funding, with 52% using private funding in 2019 compared to 63% in 2021. NHS-funded IVF cycles increased by 25% from 2020 to 2021 for patients aged 18-34, whereas privately funded IVF cycles increased by 39%. This was likely due to increased waiting times for further investigations prior to accessing NHS-funded treatments.5 See our Impact of COVID-19 on fertility treatment 2020 report for more information.
Figure 7. NHS-funded IVF cycles increased from 2020, but remain below pre-pandemic levels
Number of IVF cycles by funding type and patient age group, 2017-2021 (preliminary data 2020-2021)
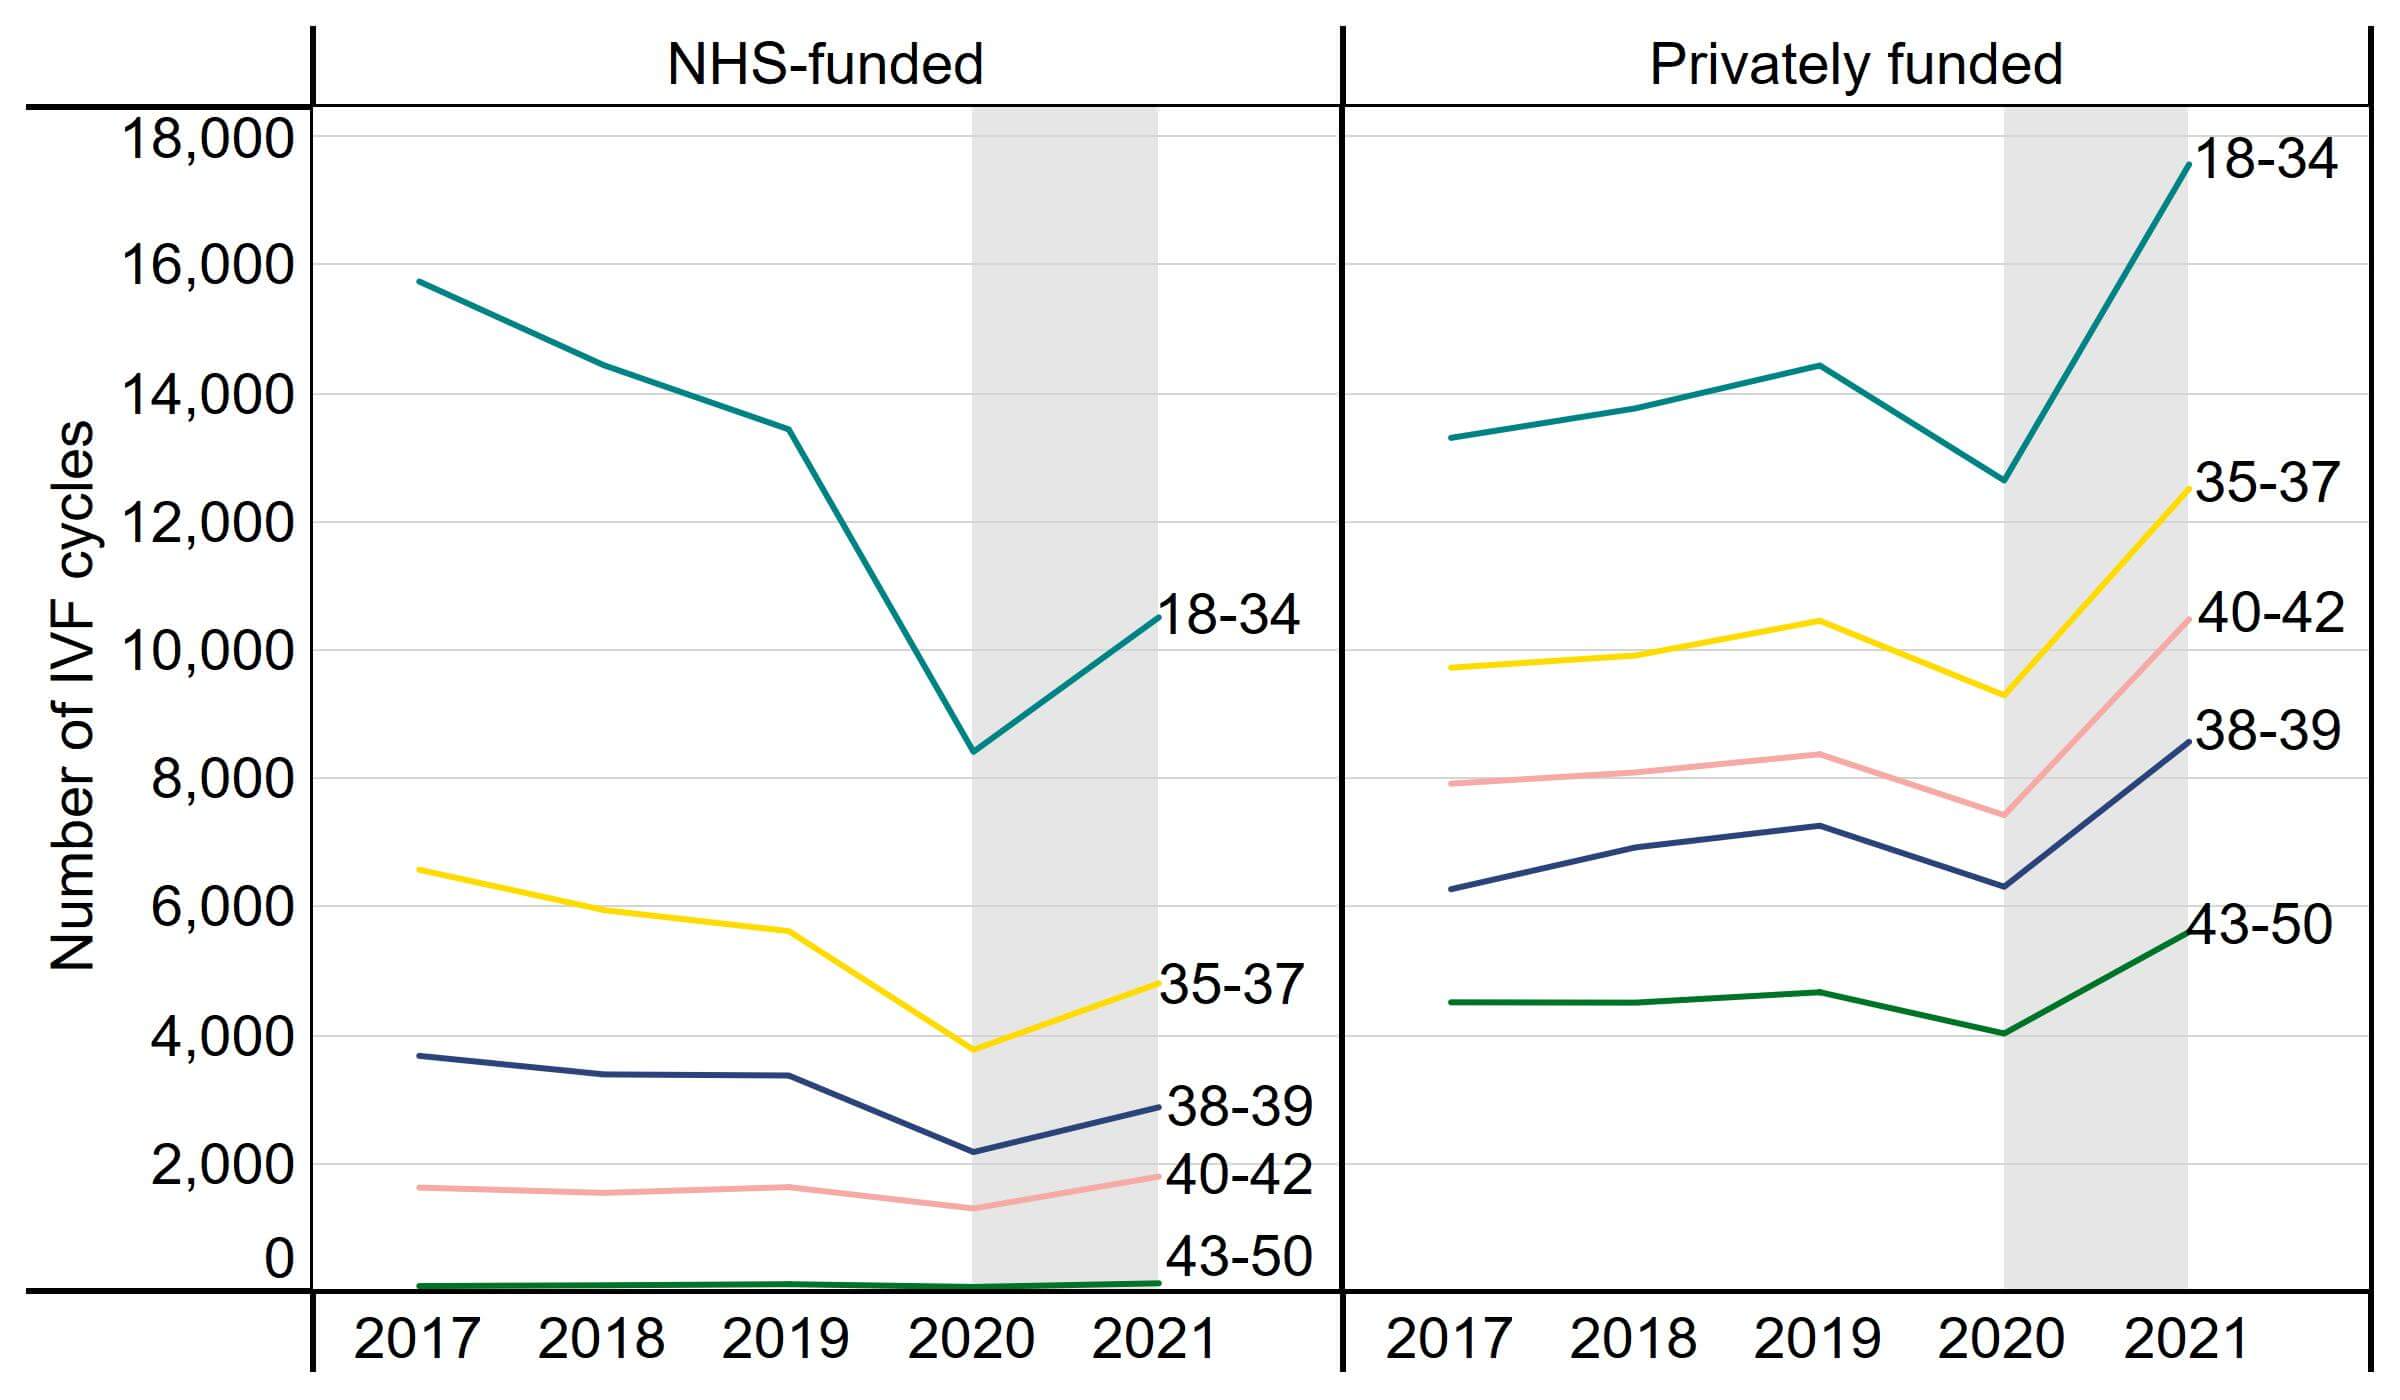
Note figure 7: This data includes IVF treatment cycles begun with the intention of having a live birth only. Data is preliminary for 2020 and 2021 (grey band).
Download the underlying data for Figure 7 as Excel Worksheet
9. NHS-funded IVF cycles decreased across the UK since 2019
NHS funding for IVF cycles varies considerably across the UK. In 2021, Scotland had the highest rate of NHS-funded IVF cycles at 58% compared to 30% in Wales and 24% in England. We are unable to report values for Northern Ireland for comparison due to technical issues in reporting from their largest clinic.
Although the number of NHS-funded IVF cycles in Scotland has risen in recent years, this slightly decreased from 2,940 cycles in 2019 to 2,924 in 2021 (-1%; Table 3). NHS-funded IVF cycles in England decreased from 19,634 in 2019 to 16,335 in 2021 (-17%). In Wales, they decreased from 1,094 to 704 over the same period (-36%). As the UK continued to see the impact of the COVID-19 pandemic on the NHS overall in 2021, it is likely that the decrease in NHS-funded IVF cycles was due in part to increased waiting times for further investigations prior to starting treatment.5
In Scotland, Wales and Northern Ireland, the level of NHS funding is set nationally, whereas funding in England is determined locally by Integrated Care Boards. NHS-funded IVF varied considerably across English regions with rates declining in all but one area from 2019 to 2021. Yorkshire and the Humber was the only English region where NHS-funded IVF cycles increased, from 1,008 in 2019 to 1,253 in 2021 (+24%).
| Table 3. NHS-funded IVF cycles decreased across all nations and most English regions | ||||
|---|---|---|---|---|
| IVF cycles funded by the NHS by nation and English region, 2019-2021 (preliminary 2020-2021 data) | ||||
| Region | 2019 | 2020* | 2021* | % change 2019 to 2021* |
| East Midlands | 1,450 | 1,204 | 1,198 | -17% |
| East of England | 779 | 538 | 724 | -7% |
| London | 5,110 | 2,682 | 4,166 | -18% |
| North East | 1,278 | 852 | 1,112 | -13% |
| North West | 4,520 | 3,275 | 3,310 | -27% |
| South East | 2,360 | 1,756 | 2,033 | -14% |
| South West | 1,321 | 826 | 1,152 | -13% |
| West Midlands | 1,808 | 1,023 | 1,387 | -23% |
| Yorkshire and the Humber | 1,008 | 990 | 1,253 | +24% |
| England | 19,634 | 13,146 | 16,335 | -17% |
| Scotland | 2,940 | 2,040 | 2,924 | -1% |
| Wales | 1,094 | 522 | 704 | -36% |
| UK total | 23,668 | 15,708 | 19,963 | -16% |
| Note table 3: This data includes IVF treatment cycles begun with the intention of having a live birth only. Data for 2020 and 2021 is preliminary (*). Data for Northern Ireland has been excluded due to data reporting issues at one clinic accounting for 60% of annual cycles in Northern Ireland. | ||||
Download the underlying data for Table 3 as Excel Worksheet
About our data
This report uses preliminary treatment and pregnancy data for 2020-2021 and preliminary birth outcome data for 2019-2021. This is because the HFEA has recently launched a new data submission system for licensed clinics and migrated our fertility treatment and outcomes data to a new database. This data migration has resulted in delays which has prevented the validation of the 2020-2021 treatment and pregnancy data and 2019-2021 birth outcome data. The difficulties completing the usual data validation processes, mean these statistics cannot be classified as official statistics. Data validation involves data quality checks that verify treatment, pregnancy and birth outcome data.
This report covers the period from 1991-2021 where data is available. Data for 1991 covers a partial year, starting in August 1991. The information that we publish is a snapshot of data provided to us by licensed clinics. The figures supplied in this report are from our data warehouse containing Register data as of 19 April 2023. Results are published according to the year in which the cycle was started. For further information, please see our Quality and Methodology report.
Unless stated otherwise, the data in this report refers to treatment cycles i.e. only those cycles where the patient recorded on their registration form that they intended to become pregnant. Averages used are provided as mean values unless stated otherwise.
About the HFEA
The HFEA is the UK’s independent regulator of fertility treatment and research using human embryos. Set up in 1990 by the Human Fertilisation and Embryology Act, the HFEA is responsible for licensing, monitoring, and inspecting fertility clinics and research centres – and taking enforcement action where necessary – to ensure everyone accessing fertility treatment receives high quality care.
The HFEA is an ‘arm’s length body’ of the Department for Health and Social Care, working independently from Government providing free, clear, and impartial information about fertility treatment, clinics and egg, sperm, and embryo donation.
The HFEA collects and verifies data on all treatments that take place in UK licensed clinics which can support scientific developments and research and service planning and delivery.
The HFEA is funded by licence fees, IVF treatment fees and a grant from UK central government. For more information visit, hfea.gov.uk.
Contact us regarding this publication
Media: press.office@hfea.gov.uk
Statistical: intelligenceteam@hfea.gov.uk
Accessibility: comms@hfea.gov.uk
Footnotes
- Data validation involves quality checking data submitted from licensed clinics across the UK to that verify treatment, pregnancy and birth outcome data is correctly recorded on our data register.
Notes on preliminary fertility treatment 2021: trends and figures
- Epidemiology of multiple pregnancy: changing effects of assisted conception in: Multiple Pregnancy, Kurinczuk, J., Kilby M et al (eds) RCOG 2006
- The Impact of the COVID-19 Pandemic on Pregnancy Planning Behaviors, Women’s Health Reports, 2021, 2.1:71-77
- Birth characteristics in England and Wales: 2021 – Office for National Statistics, 19 January 2023
- Human Fertilisation and Embryology Act 2008
- More than half a million women face prolonged waits for gynaecology care – Royal College of Obstetricians and Gynaecologists, 4 April 2022
Review date: 15 April 2027

